Geotechnical Cross Sections and 3D Borehole Visualisation
Turn your borehole logs into clear, defensible visual outputs. Generate geotechnical cross sections, fence diagrams and interactive 3D borehole views directly from logged data to support reporting, design and regulatory submissions across Australian projects.
Data Visualisation
Interactive subsurface views
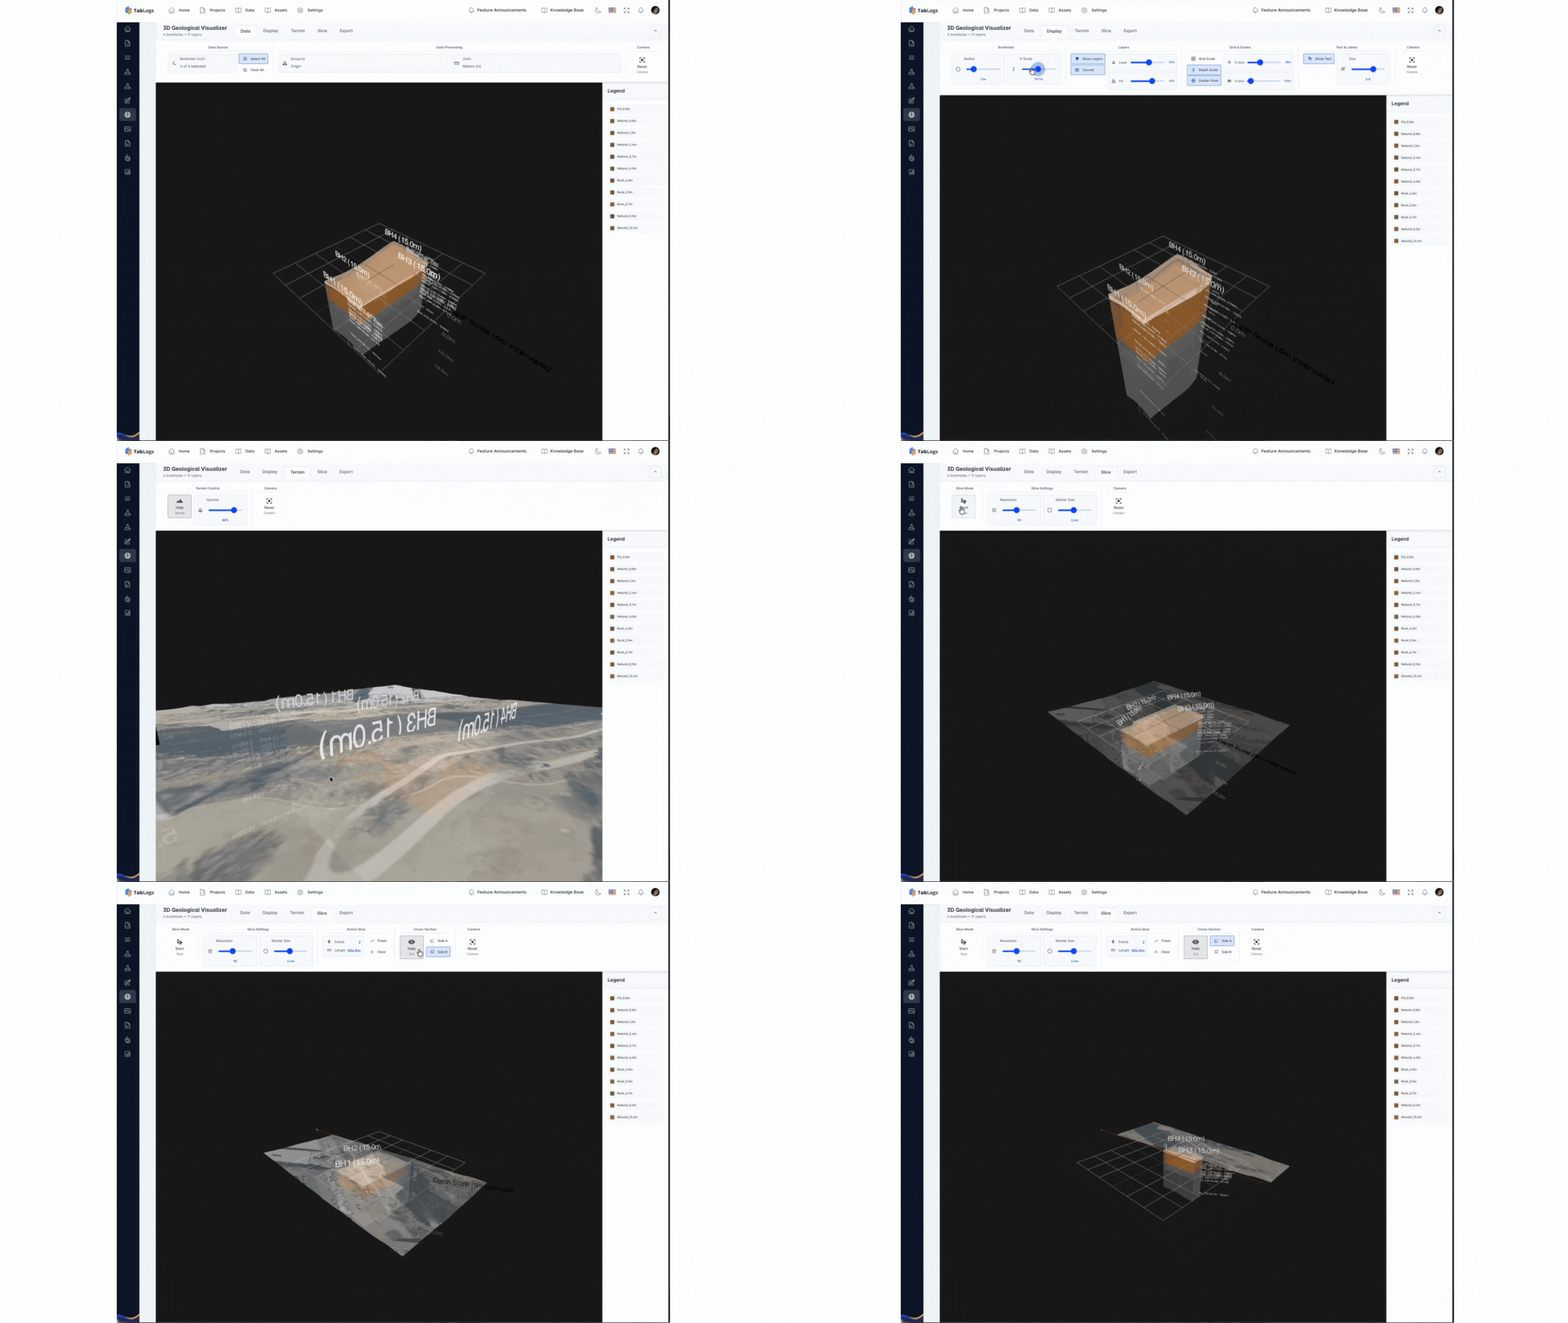
Generate Geotechnical and Geological Cross Sections
Turn your borehole logs into interactive 3D models that make subsurface conditions easy to interpret and explain. TabLogs automatically plots borehole locations and stratigraphy in a 3D site view, allowing engineers to explore soil and rock layers from any angle. Adjust surface transparency, pan and zoom across the site, and overlay geological map layers to understand how subsurface conditions relate to surface features. Use 3D views to validate subsurface interpretations, identify inconsistencies, and create clear visuals for client reports and design discussions.
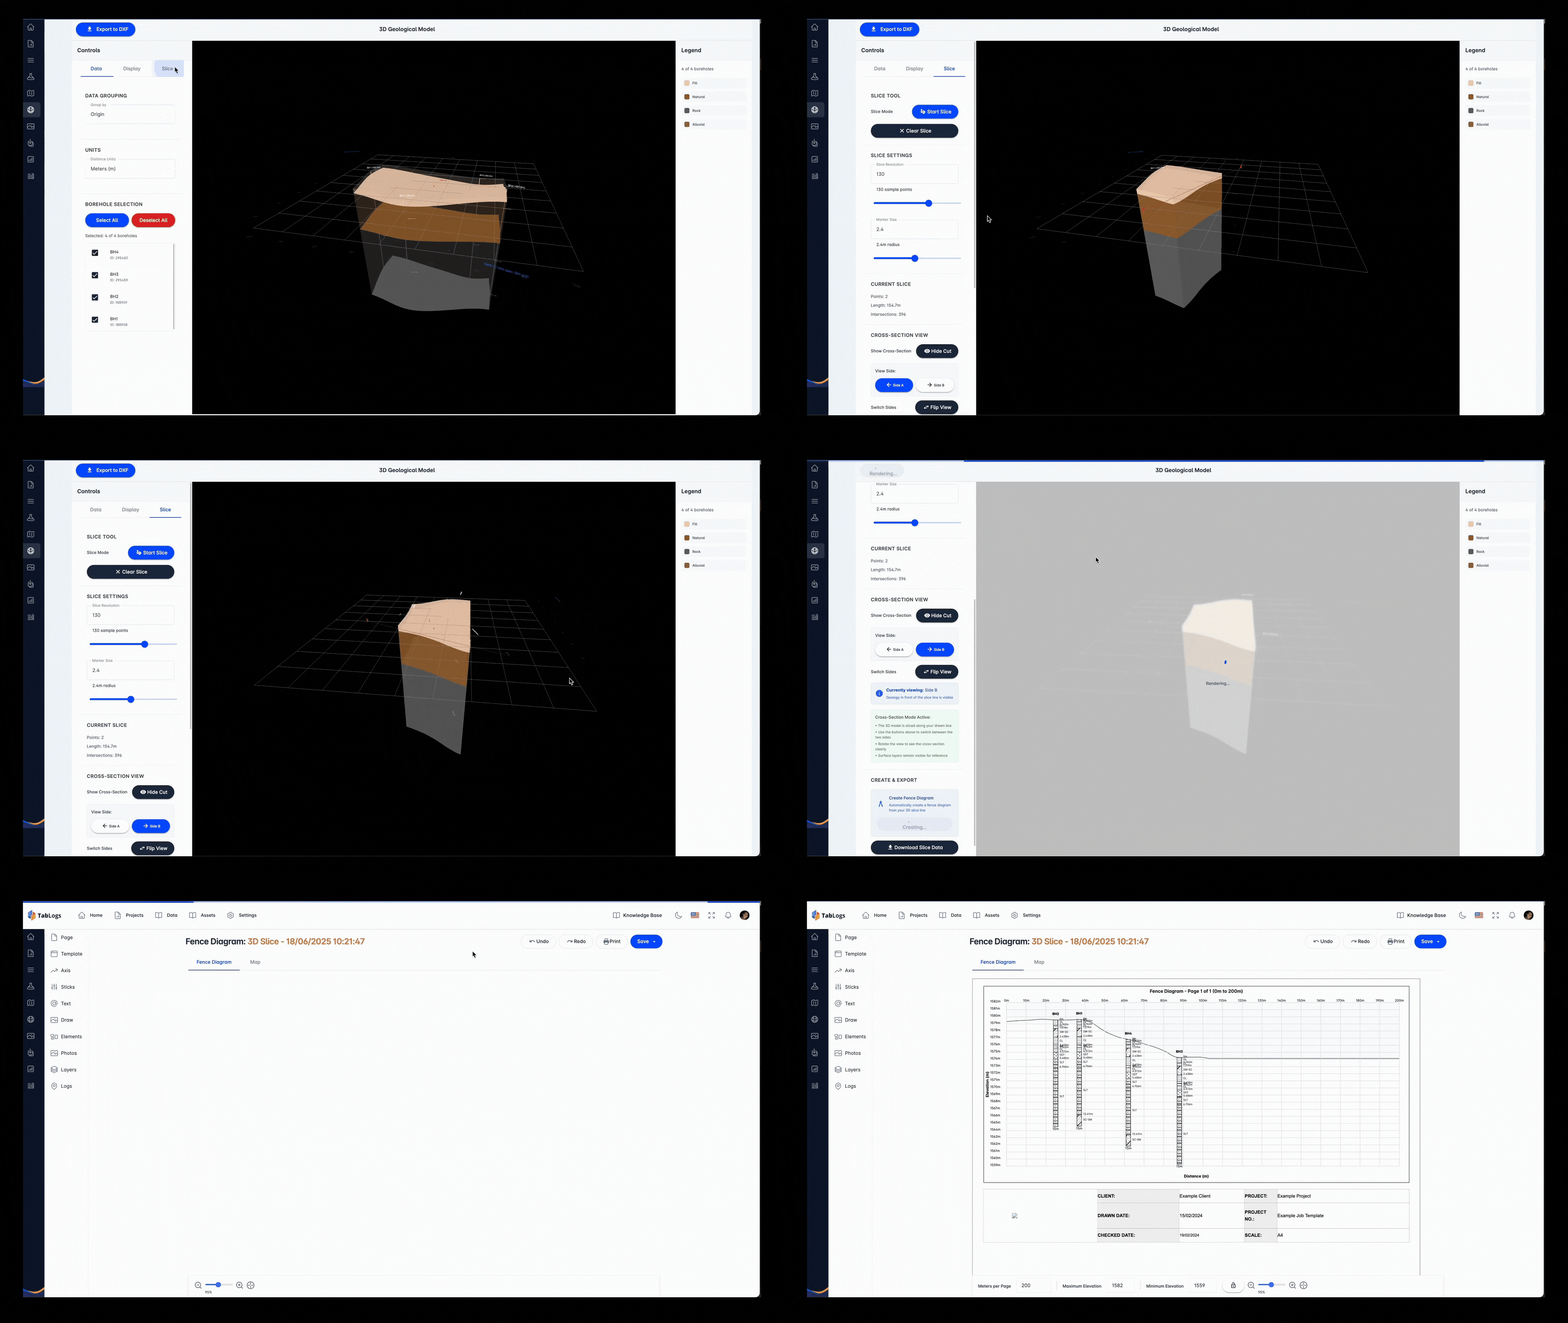
Create Fence Diagrams to Interpret Stratigraphy Across Your Site
Generate fence diagrams and geological cross sections directly from your boring log data. TabLogs removes the need for manual drafting by automatically aligning boreholes and interpolating subsurface layers across your site. Group layers by origin, classification, or custom rules to maintain consistent symbology across projects. Surface layers are added automatically, with full control over line styles, labels, and annotations. Clearly visualize stratigraphy and material continuity across your site without redrawing sections by hand. Fence diagrams and cross sections can be exported into geotechnical reports, making it easier to communicate subsurface conditions to clients, reviewers, and regulators.
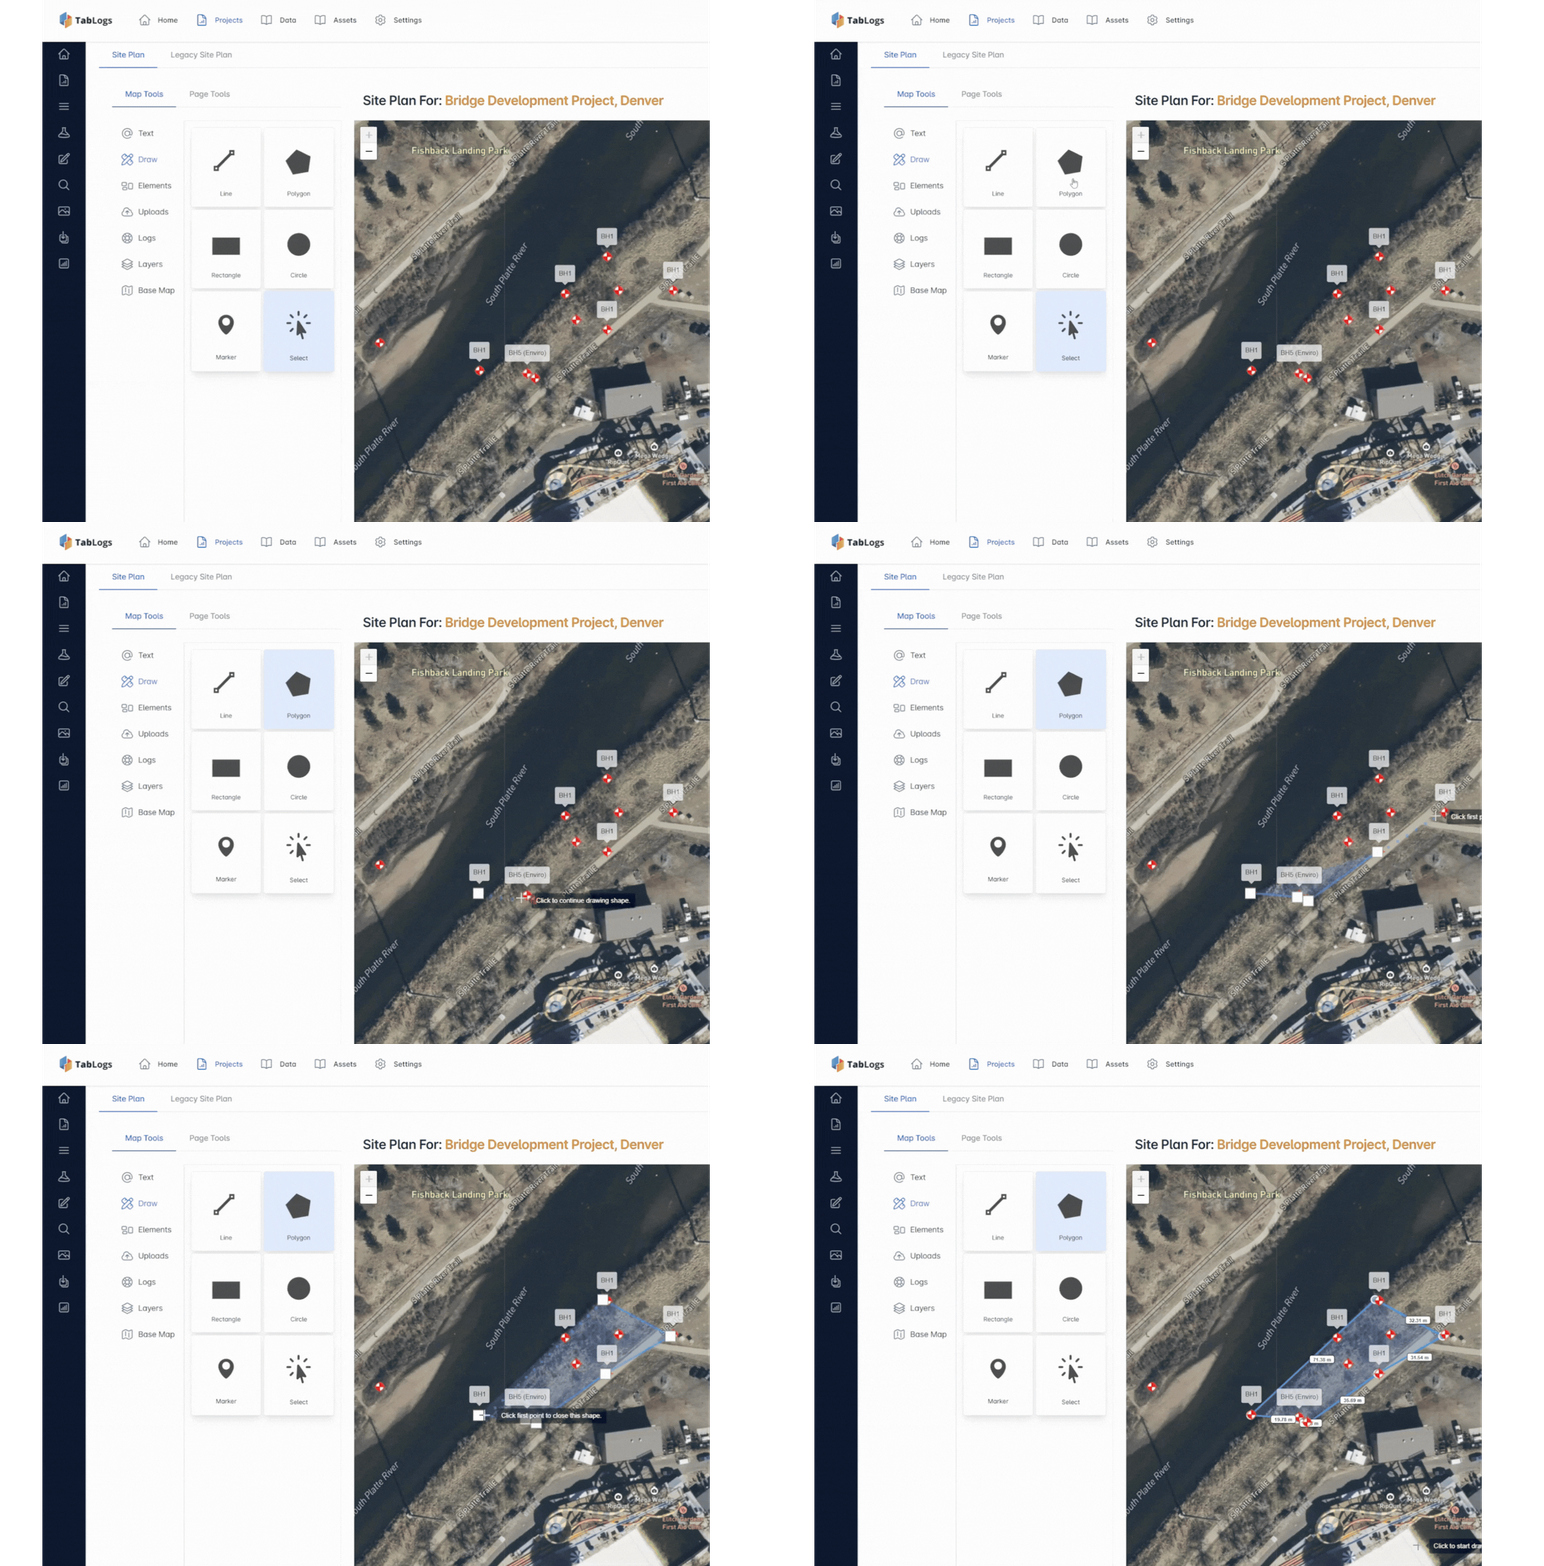
Map Boreholes with Scaled Site Plans and GPS Data
Automatically map borehole locations using GPS data captured in the field. TabLogs generates scaled site plans that show borehole spacing, investigation coverage, and site context without manual drafting. Add notes, comments, and color coding to highlight key features such as vegetation, access constraints, or investigation boundaries. Site plans update as new data is collected, ensuring your report figures remain accurate and consistent from fieldwork through final delivery. Site plans can be used directly as report figures or shared with project teams for coordination and review.
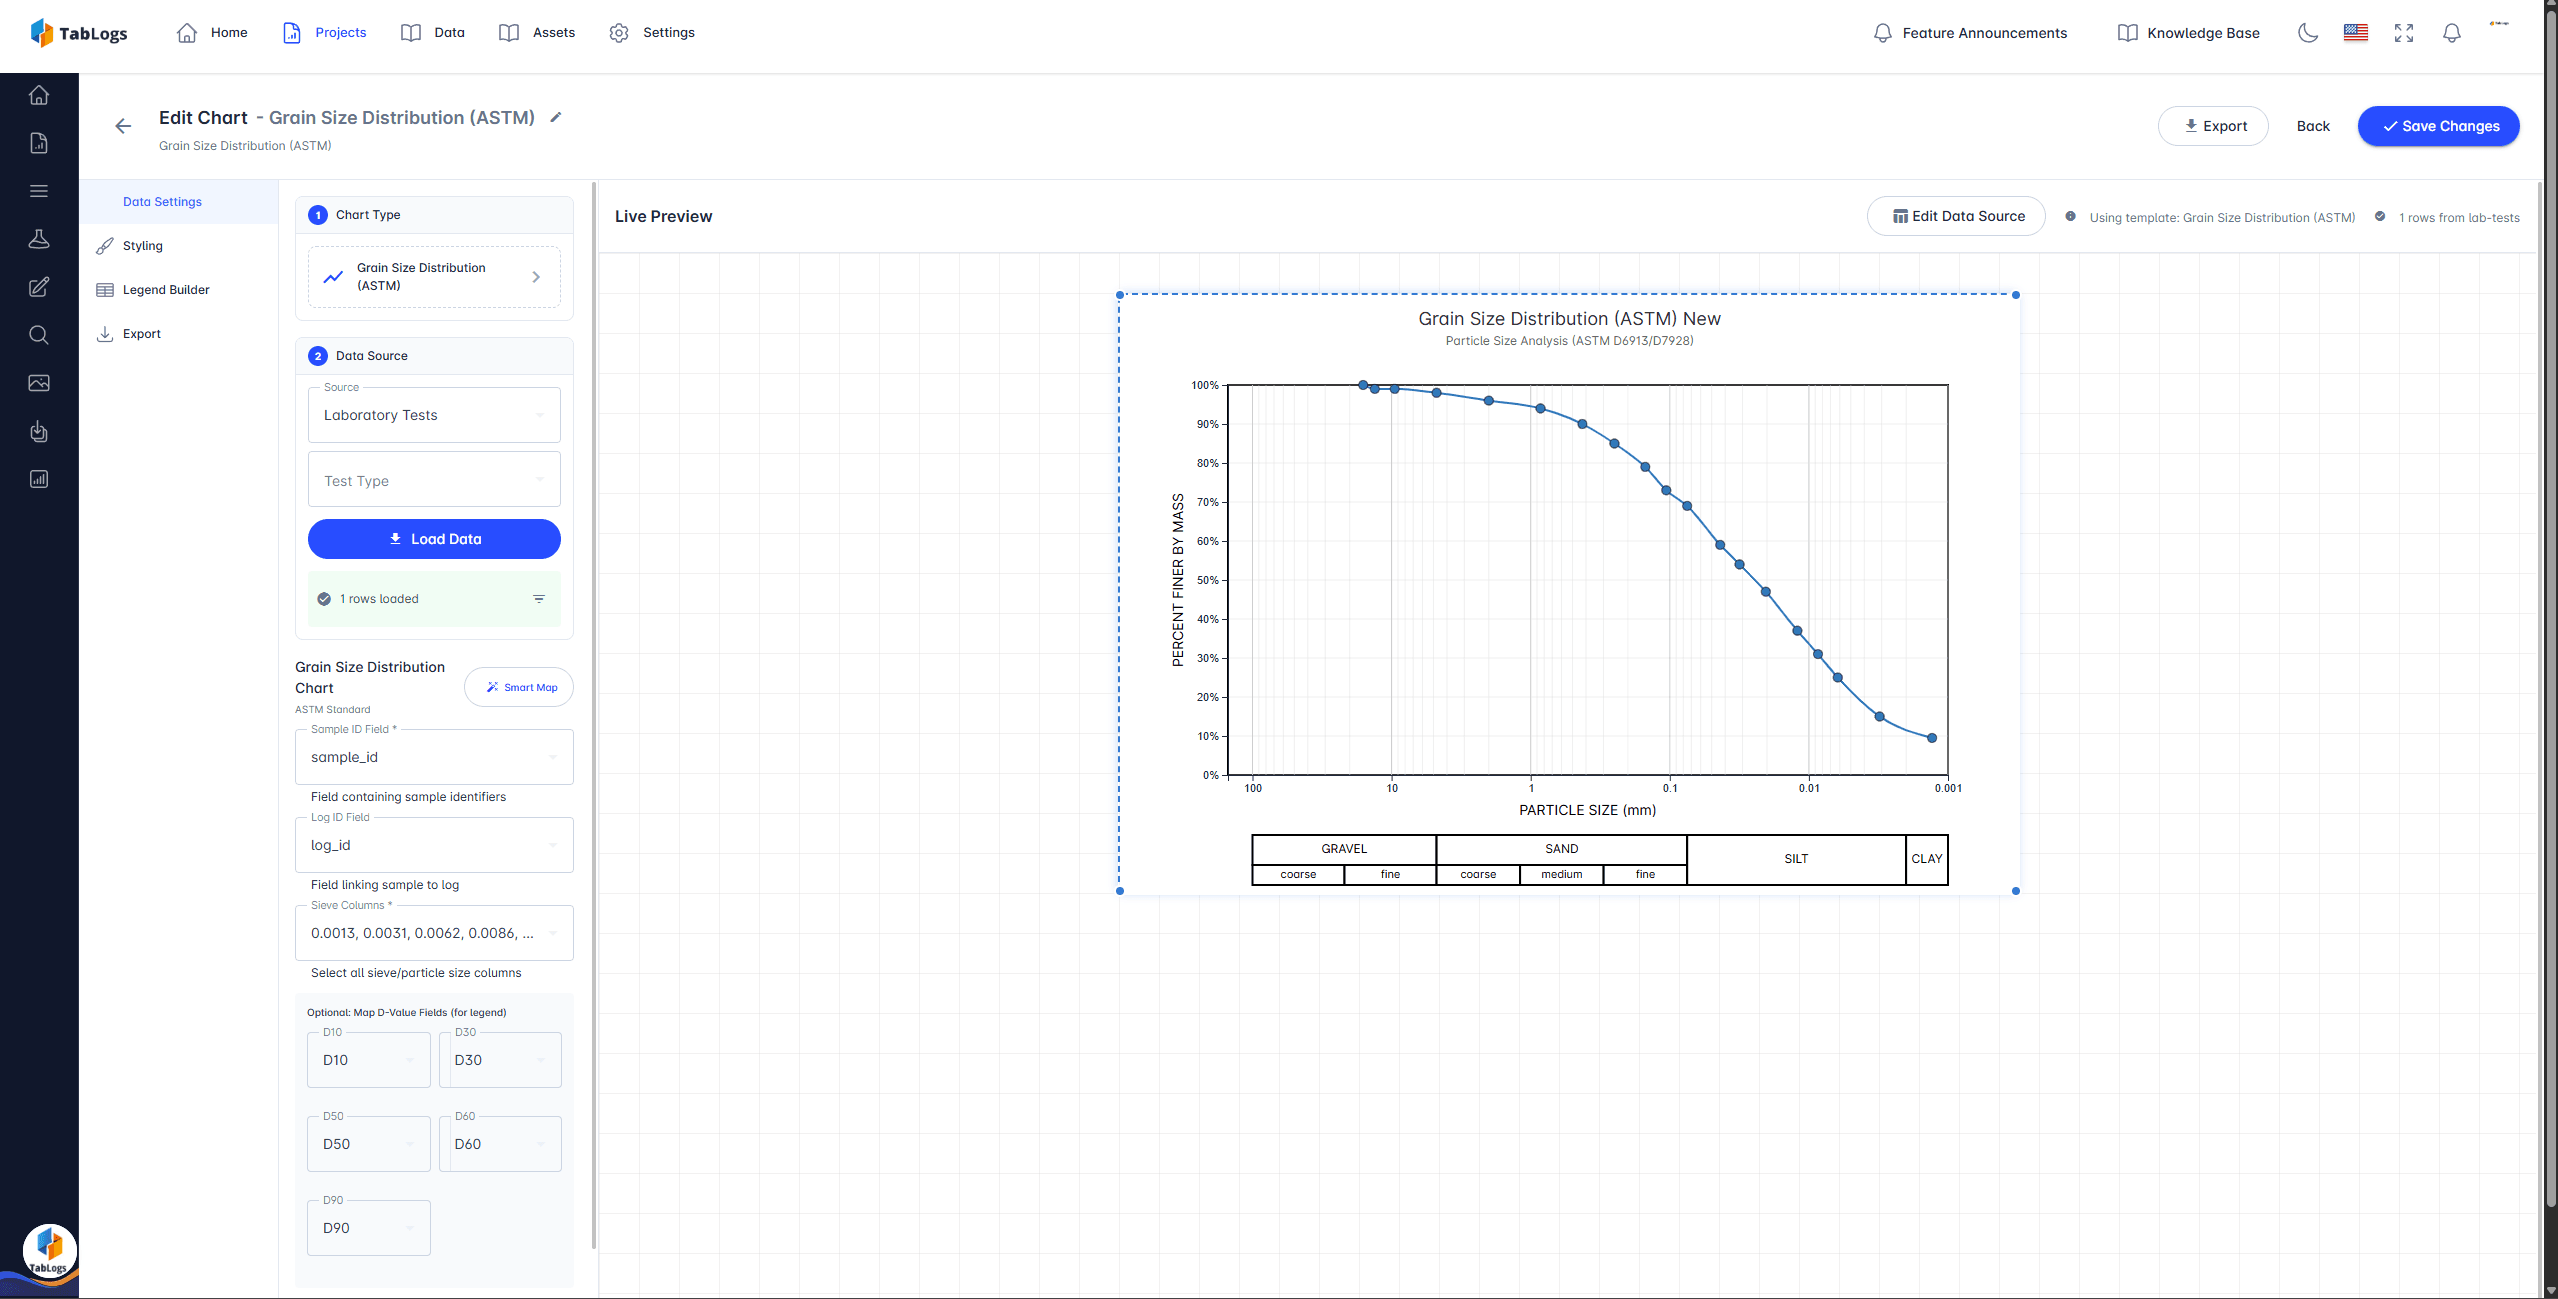
Built for Australian Geotechnical and Environmental Reporting
Every visualization in TabLogs is designed to support professional geotechnical and environmental reports. Visuals are generated directly from your logged data, reducing transcription errors and improving consistency across logs, sections, and figures. Use TabLogs visuals to streamline QA, speed up report preparation, and deliver clear, defensible outputs that clients and reviewers can trust. Consistent symbology and standardized visuals help ensure alignment with internal QA processes and client expectations.
Ready to visualise your data?
Create stunning cross-sections and site plans with TabLogs.