Customizable Geotechnical Report Templates
Create site investigation reports, borehole logs and deliverables that look exactly like the formats your consultancy already uses.
Templates & Exports
Customizable report formats
North American standards & consultant adoption
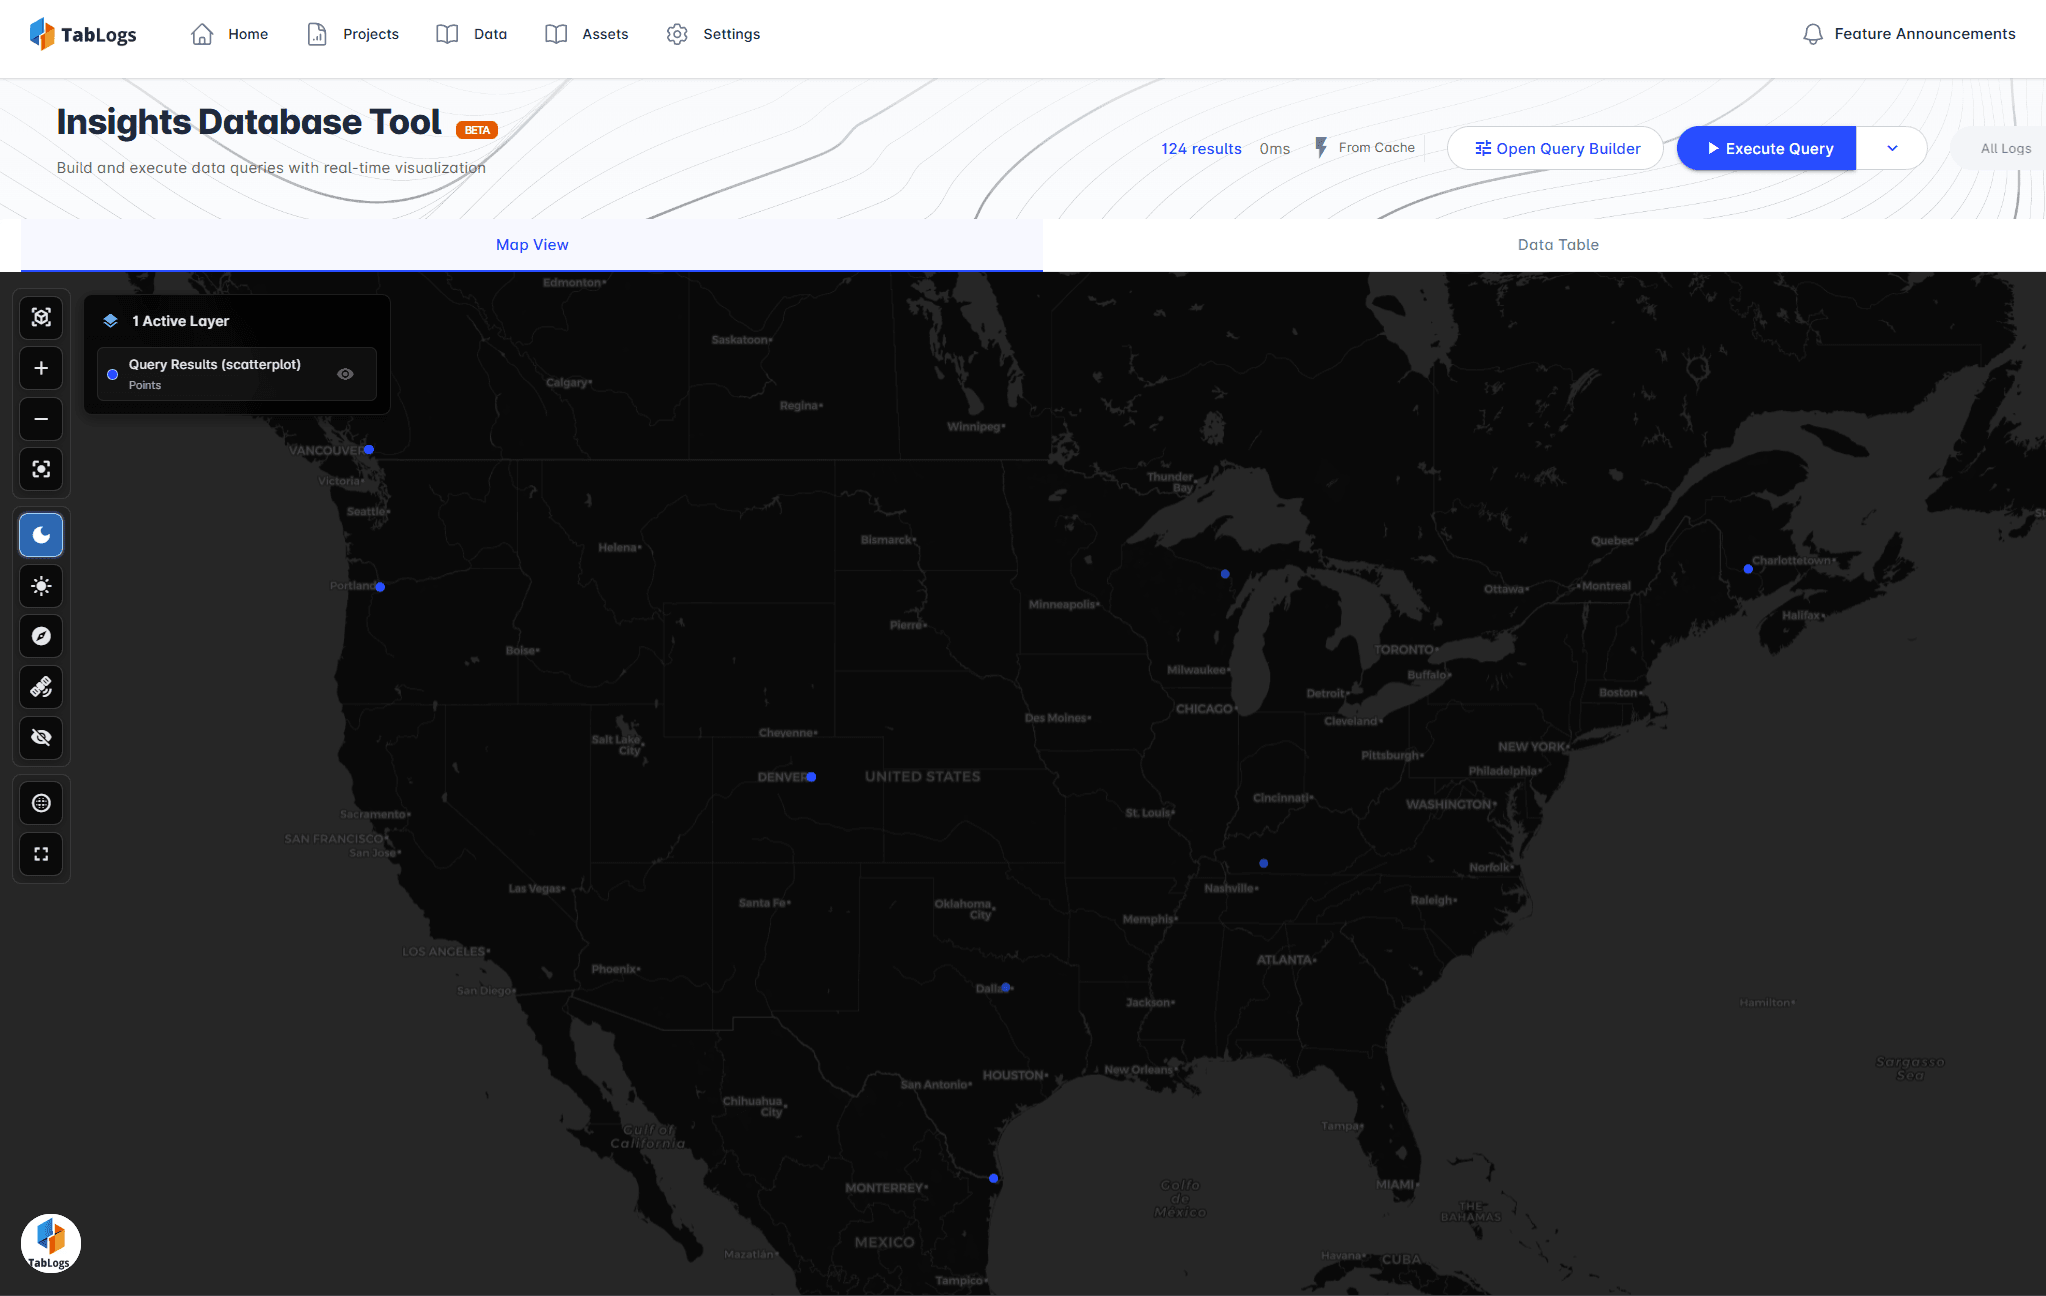
TabLogs includes approved log configurations used by 400+ consulting firms across North America, including DOT-aligned templates and standardised reporting frameworks. These configurations help teams maintain consistency across offices while reducing setup time.
Create Geotechnical Reports That Match Your Existing Formats
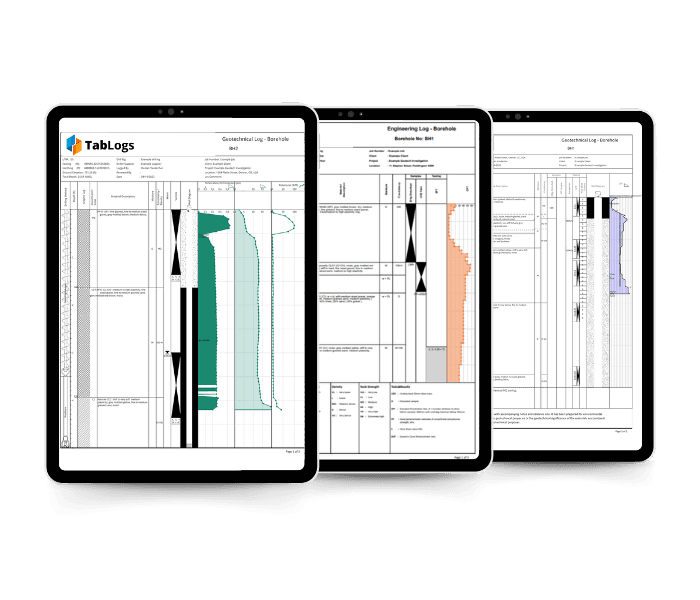
TabLogs is built for engineers who do not want to redesign their reports just to adopt new software. Every report template can be configured to mirror your existing layouts, column structures, symbols, scales and annotation styles. Nothing is locked into a fixed format. If your consultancy has spent years refining its borehole logs and site investigation reports, TabLogs lets you reproduce those formats digitally without compromise. Your outputs can look the same on day one, while giving you the flexibility to improve or modernise them later if you choose. This approach means no client surprises, no internal pushback and no need to retrain teams on unfamiliar report structures.
Build and Maintain Your Own Borehole Log Template Library
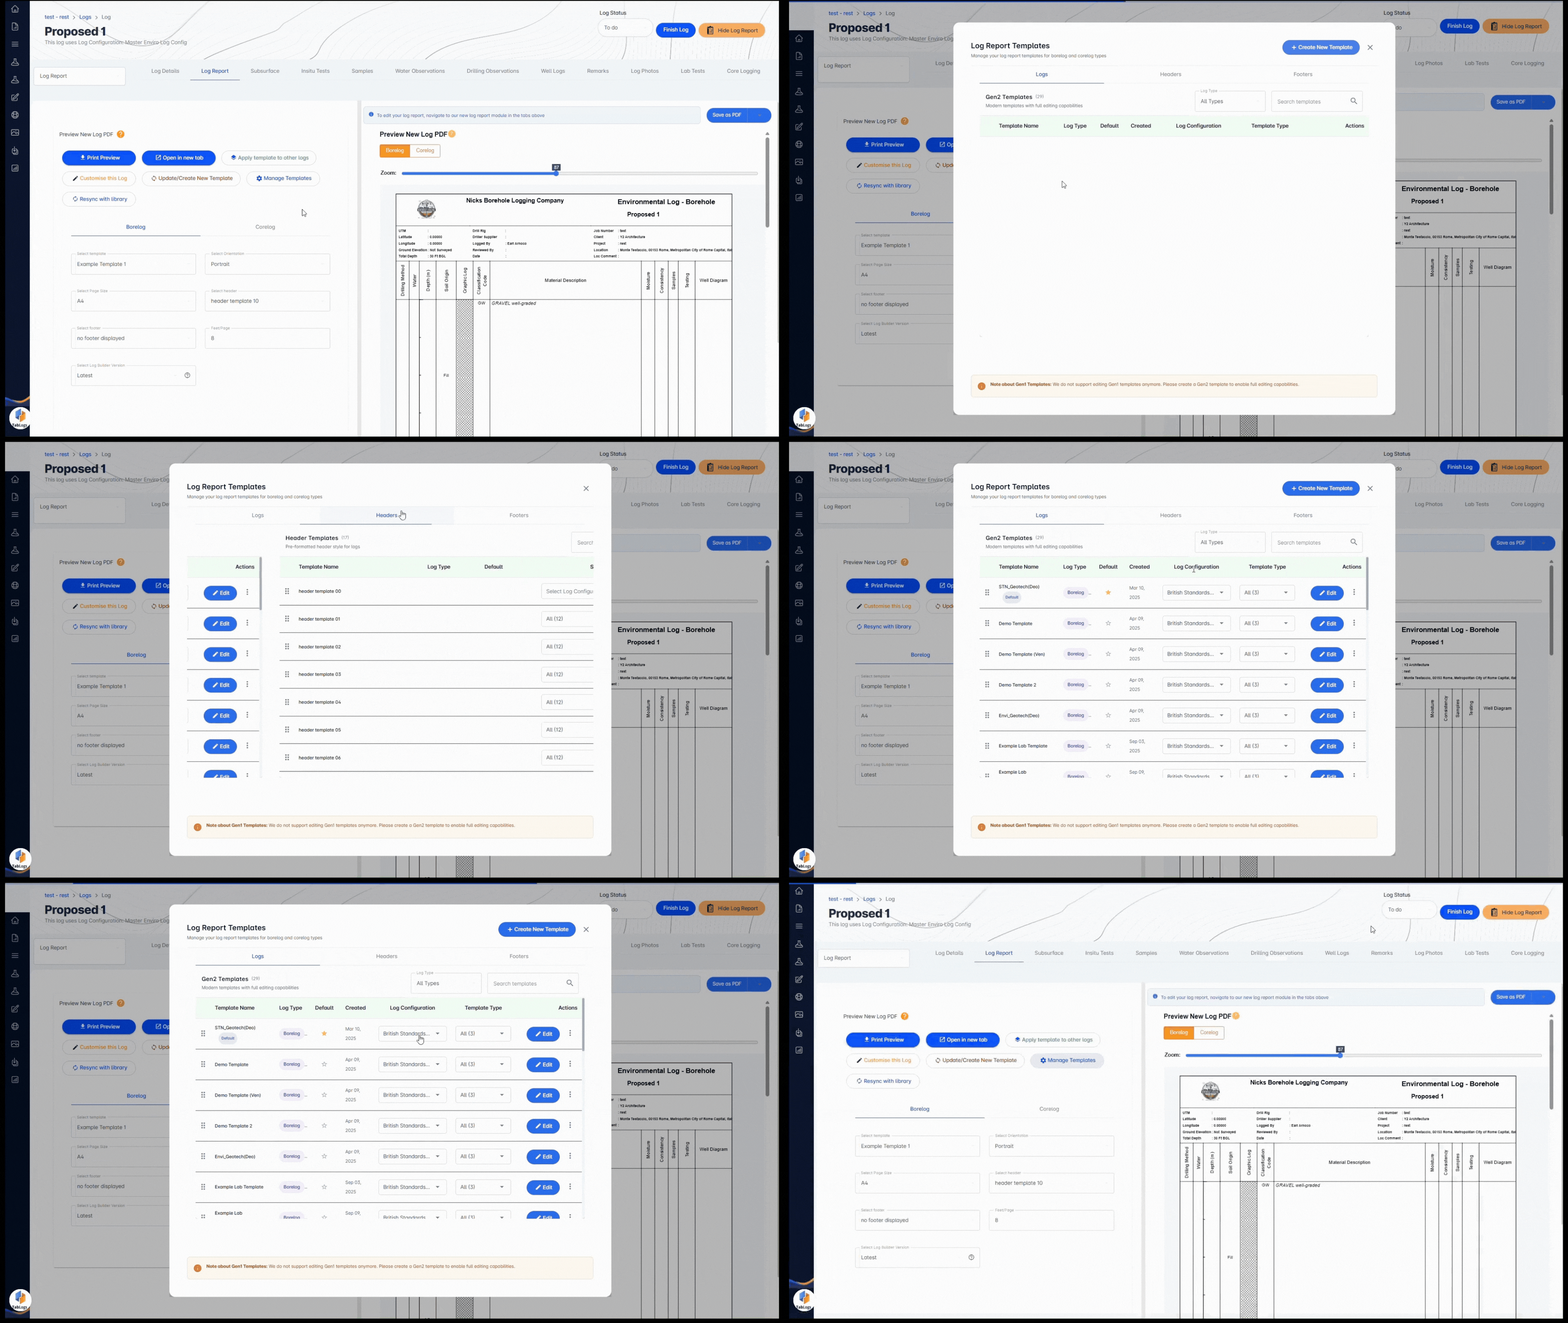
Create and manage a centralized library of borehole log templates that reflects how your organisation works across different project types. Whether you deliver geotechnical, environmental, infrastructure or contamination assessments, TabLogs allows you to maintain multiple template styles for different clients, regions or investigation standards. Templates can be duplicated, refined and updated over time, ensuring consistency across projects while still allowing flexibility when required. Templates can also be shared across teams, ensuring consistent outputs regardless of who is logging data in the field or preparing reports in the office. Standardise where it matters, customise where it counts, and keep full control over how your logs are presented.
Add Charts, Photos and Drill Graphics Without Changing Layouts
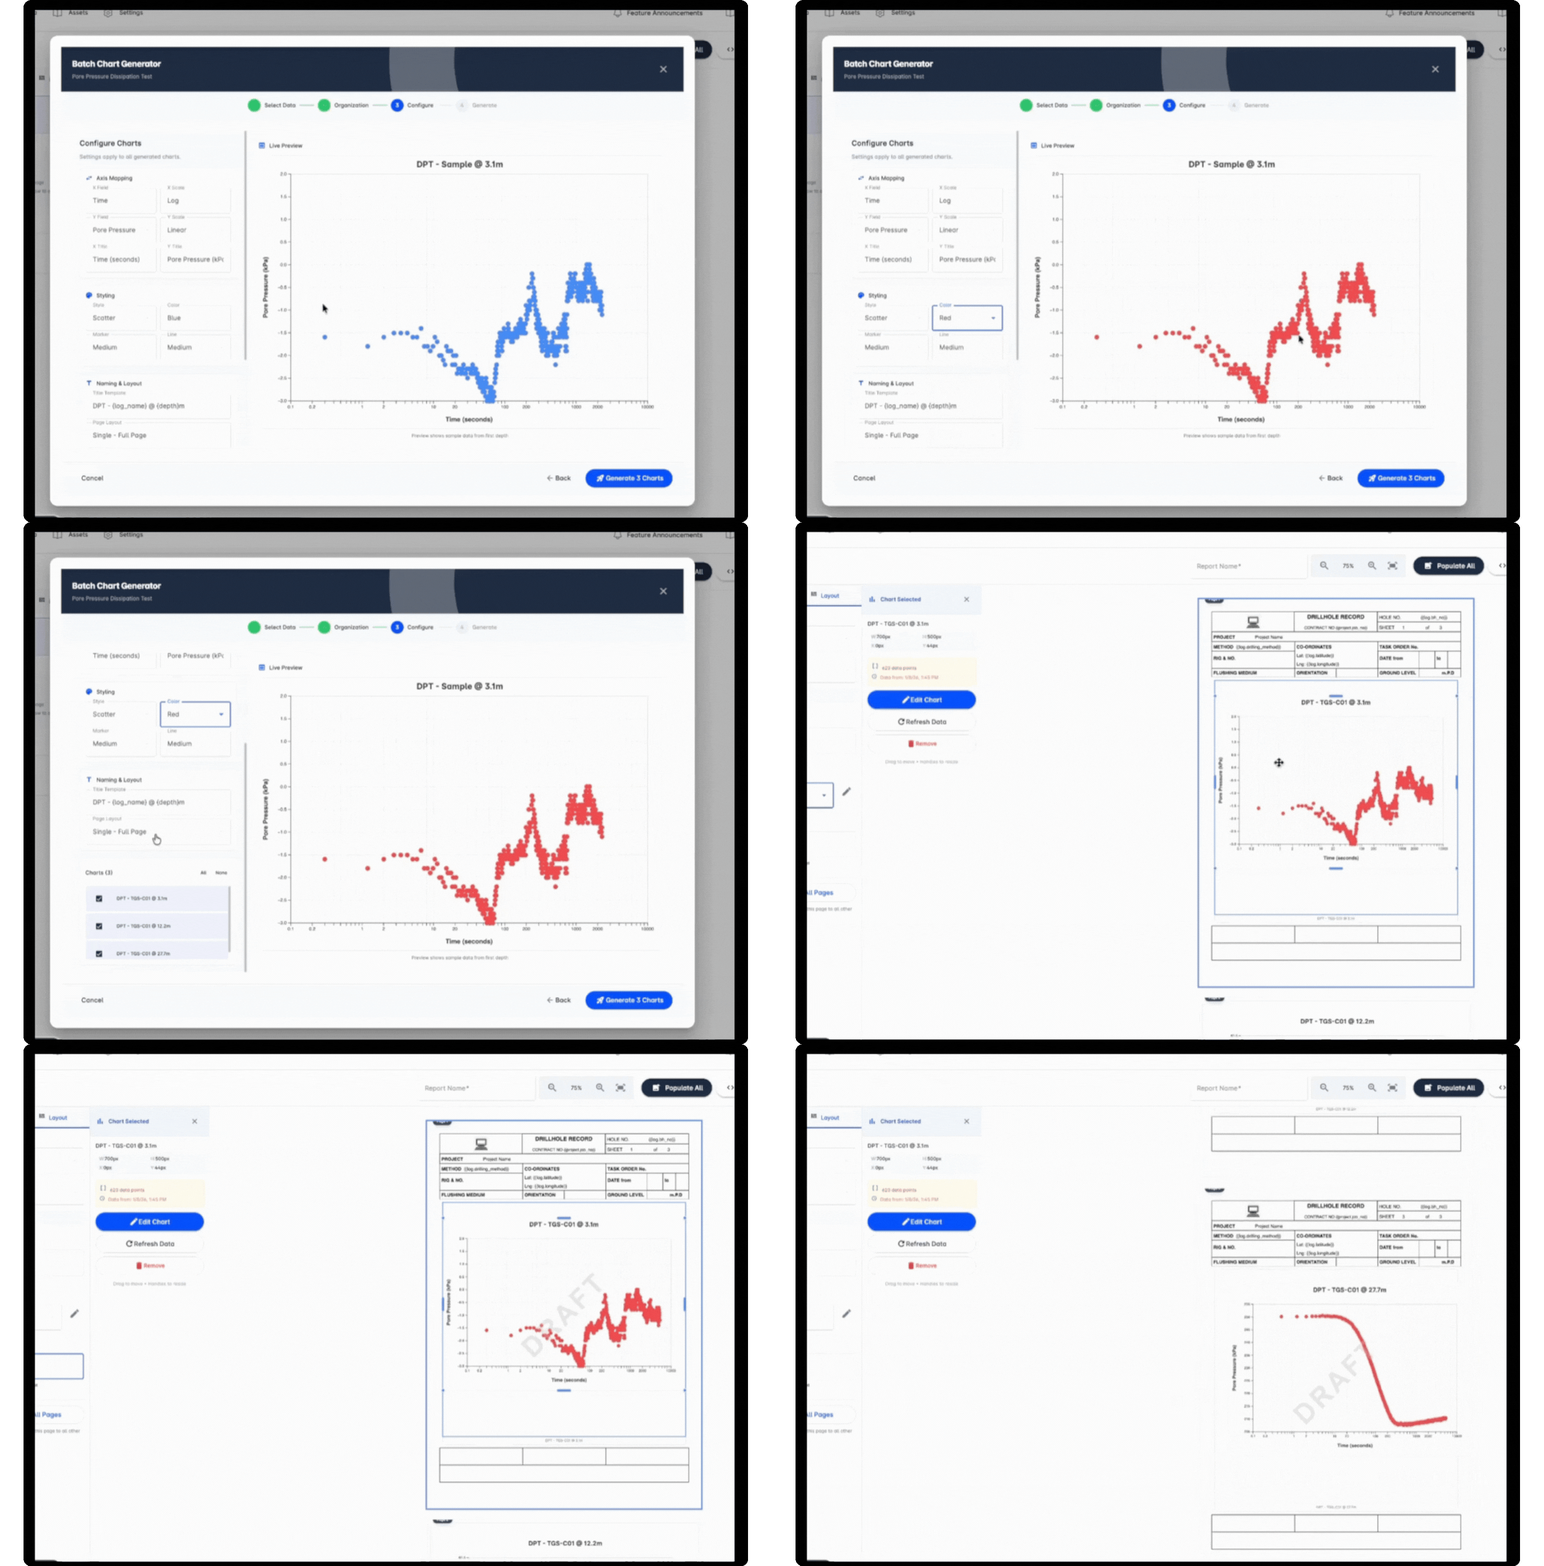
Enhance your reports with charts, photos and drilling graphics without disrupting your established layouts. Plot common geotechnical data such as SPT N values, moisture content or strength parameters directly within your templates using line graphs, scatter plots or area charts. Incorporate photos into borehole logs in column or row formats that align with your existing presentation standards. Drilling graphics can be added to clearly show drilling methods and changes with depth, helping readers quickly understand how each borehole was constructed while maintaining consistent visual language across your organisation. All visual elements respect your existing spacing, column widths and depth scales, so reports remain familiar to reviewers and clients.
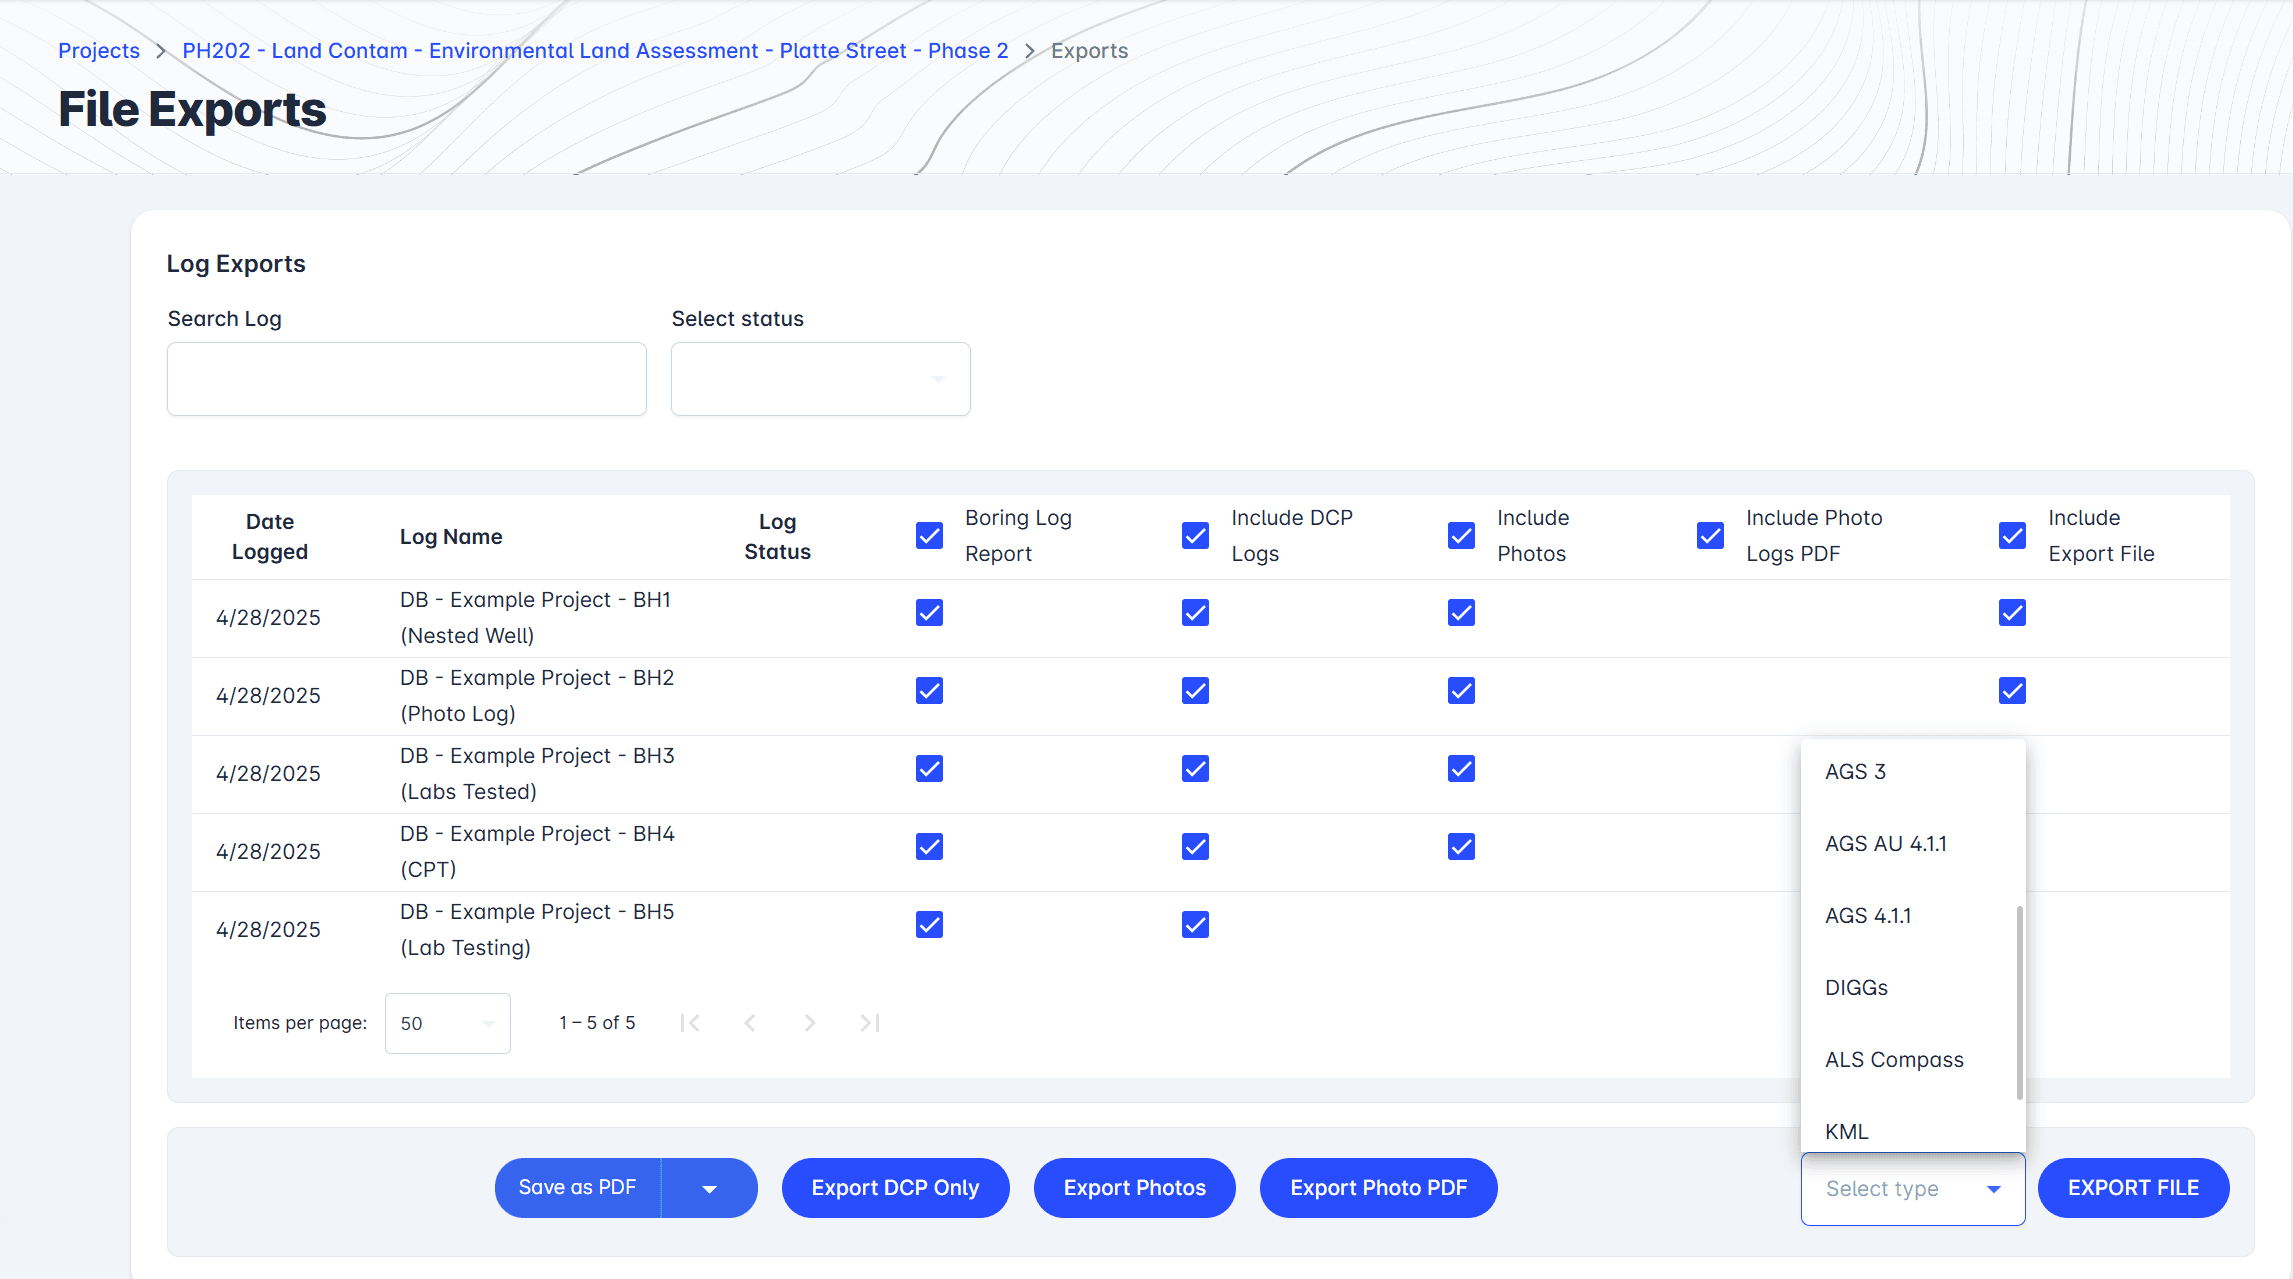
Export to PDF, Excel and gINT Without Rework
Generate client ready deliverables directly from TabLogs in the formats your workflows already rely on. Export your reports and logs to PDF and Excel, or generate gINT compatible outputs for teams transitioning away from legacy geotechnical software. Your templates remain intact during export, meaning no post processing, no manual formatting and no rebuilding reports outside the platform. This makes TabLogs suitable for both modern digital workflows and teams that still need compatibility with existing systems and historical datasets.
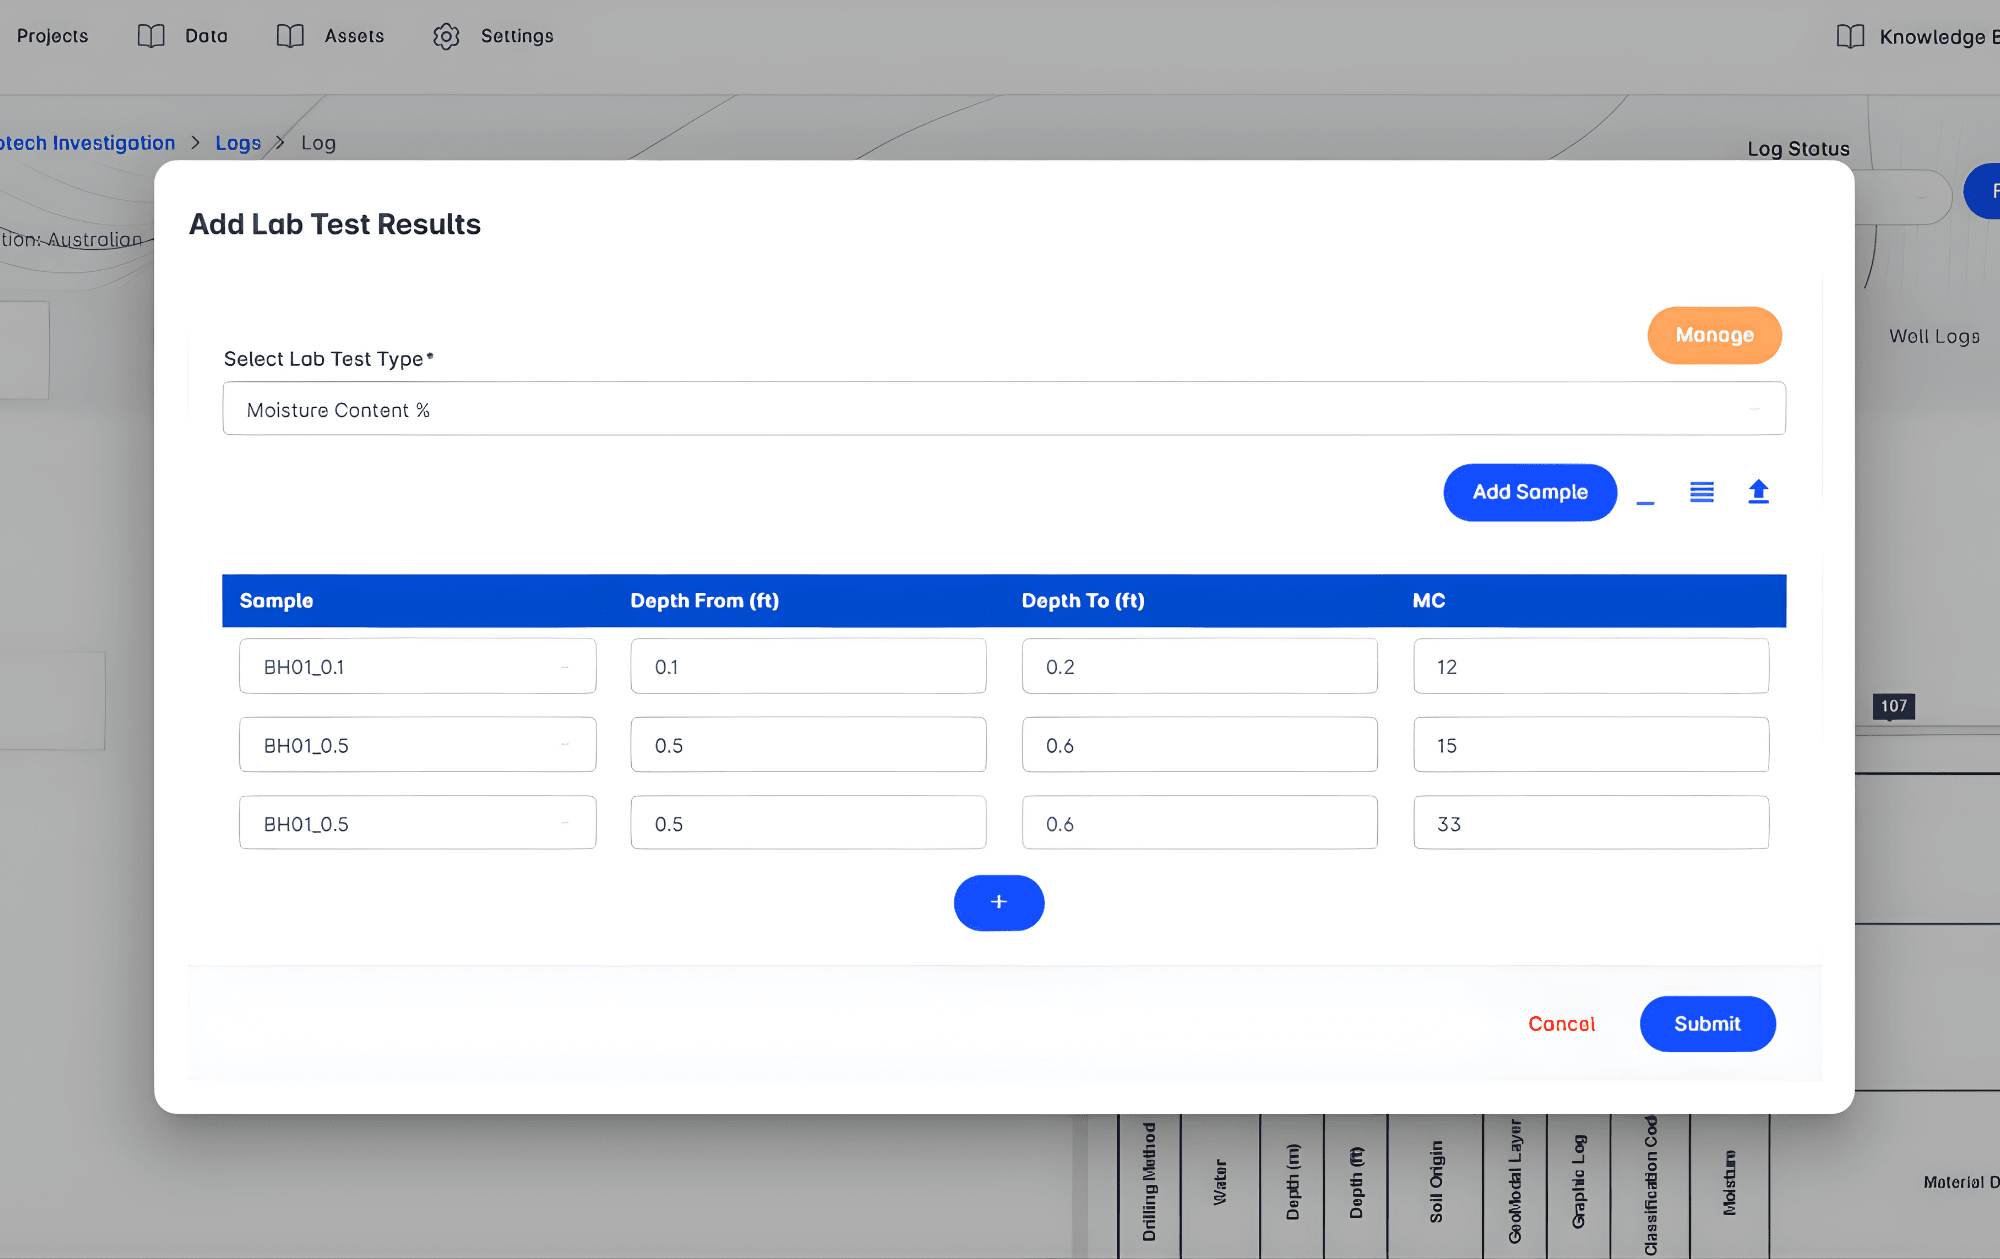
Support for Lab Data and Soil Testing Workflows
Integrate laboratory test data directly into your reporting workflow while maintaining consistent presentation. TabLogs allows you to filter, organise and reference lab samples by depth, material description, sample type and other key attributes, ensuring only relevant data appears in your reports. Lab results can be incorporated into templates in a structured, repeatable way that aligns with your consultancy’s reporting standards. This ensures field data and lab results are presented together clearly, reducing manual handling and improving confidence in final deliverables.
- Effortlessly Organize Samples: Easily categorize and organize project samples based on key attributes, simplifying the process of selecting samples for lab testing.
- Target Specific Samples: Quickly identify and select samples that require further testing, optimizing your lab testing resources.
- Create Strategic Test Requests: Generate test requests with precision, ensuring that each test is strategically aligned with project requirements.

Built for Engineers Moving Away From Rigid Reporting Software
Many geotechnical teams delay switching software because rigid templates force report redesigns and client reapproval. TabLogs removes that barrier by letting you recreate your current formats first, then improve them when it suits your workflow. You stay in control of your reporting standards at every step.
Ready to create custom templates?
Match your company standards with customizable log templates.