Visualize Borehole Logs and Subsurface Data Across Your Site
Turn your borehole logs, test pits, CPTs, and sampling data into clear geological cross sections, fence diagrams, and mapped site plans that support confident geotechnical and environmental decisions across Canada.
Data Visualisation
Interactive subsurface views
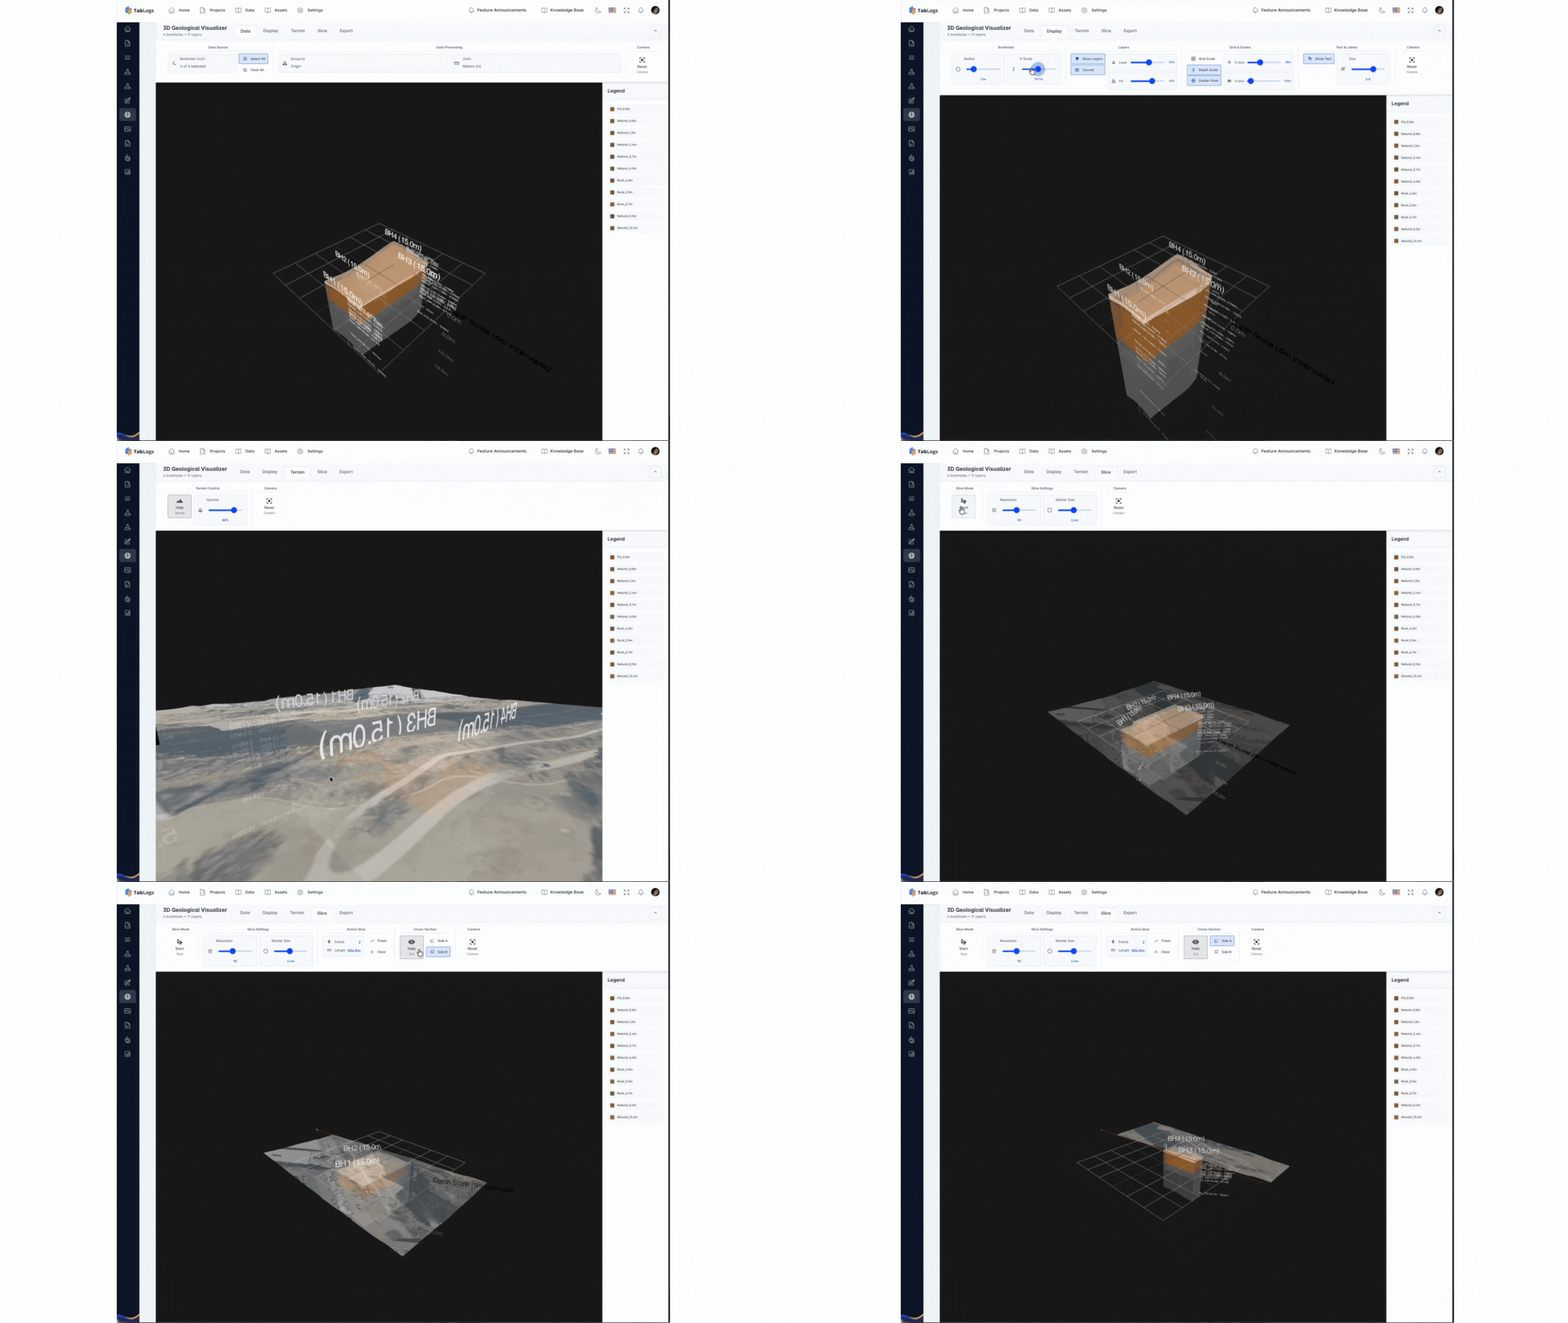
Generate Geological Cross Sections from Borehole Logs
Create accurate geological and geotechnical cross sections directly from your borehole log data. Boreholes are automatically aligned by location and elevation, plotting stratigraphy, soil layers, rock units, and groundwater levels without manual drafting. Interpret subsurface conditions in interactive views that allow you to pan, zoom, and adjust transparency to evaluate layer continuity, depth changes, and material variability. Surface profiles and ground elevations are generated automatically to reflect true site conditions. Export cross sections directly into your geotechnical reports for foundation design, slope stability assessments, transportation projects, infrastructure corridors, mining developments, and environmental investigations across Canada. Maintain consistent symbology and layer representation across all sections without redrawing figures in CAD.
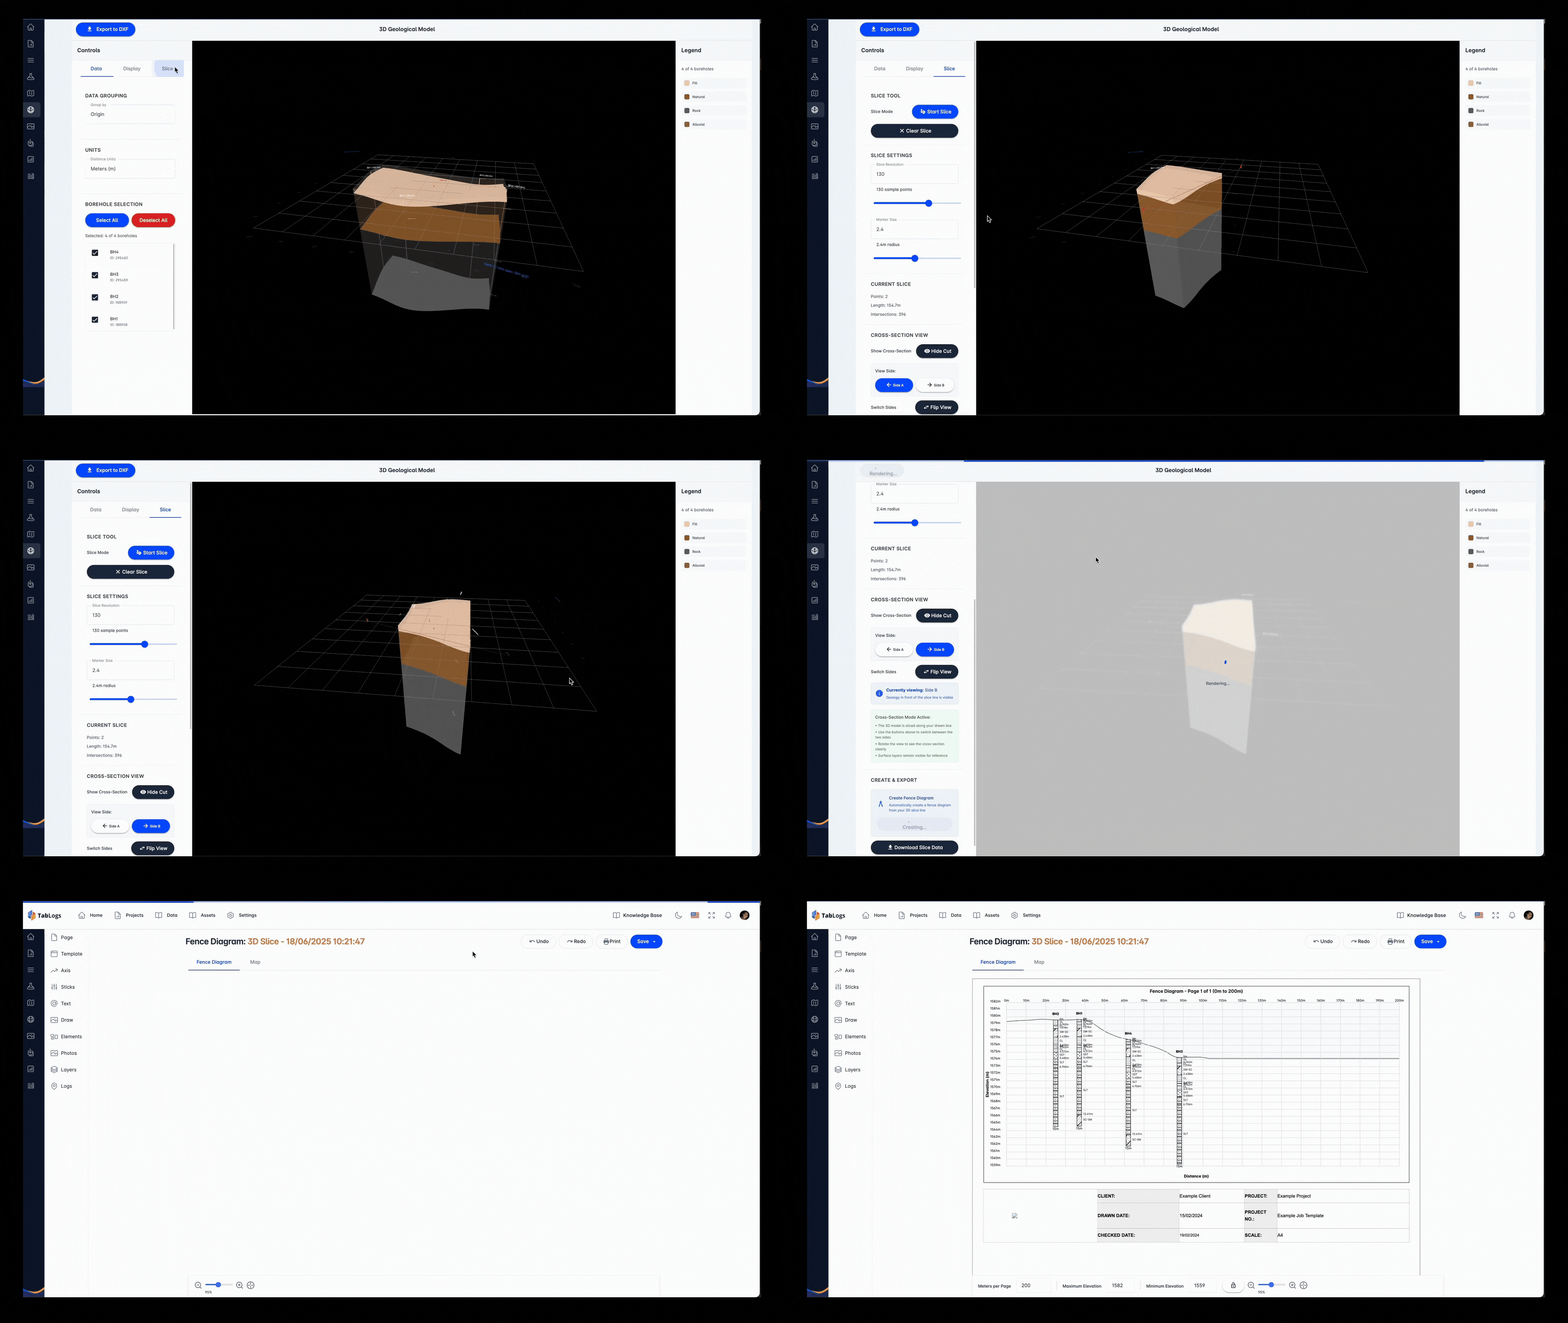
Create Fence Diagrams to Interpret Stratigraphy Across Your Site
Generate fence diagrams that clearly show stratigraphic relationships between boreholes across your project area. Subsurface layers are interpolated between selected boreholes to help assess material continuity, depth variation, and geological trends. Group layers by soil classification, lithology, origin, or custom project rules to maintain consistent representation across projects and regions. Control labels, line styles, hatching, and annotations to match internal QA standards and client reporting requirements. Fence diagrams can be exported as high quality figures for geotechnical reports, environmental site assessments, transportation infrastructure, linear corridors, and resource projects. Present defensible, data-driven stratigraphic interpretations that improve clarity for clients, reviewers, and regulators.
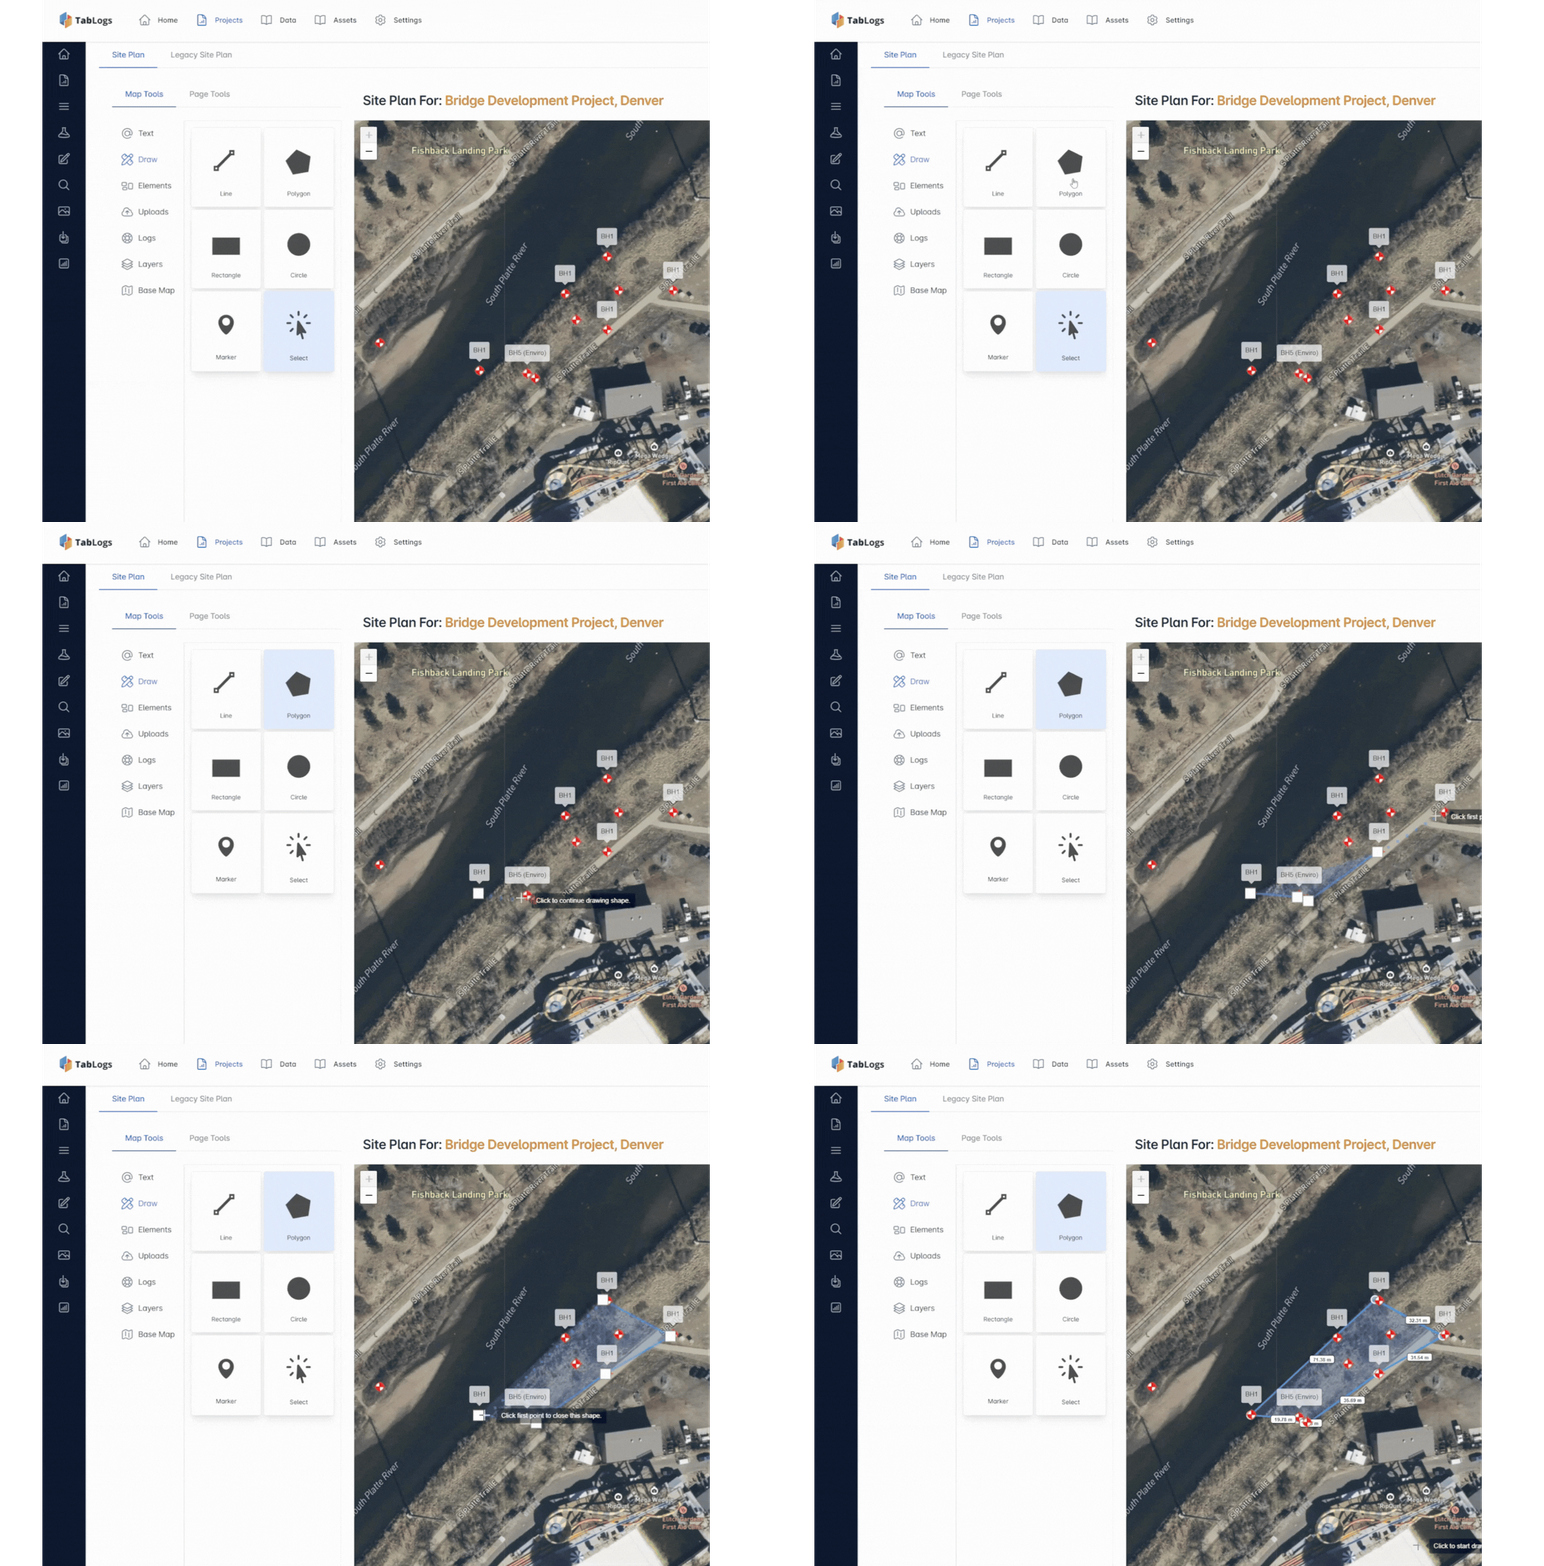
Map Boreholes with Scaled Site Plans and GPS Data
Visualize borehole locations, test pits, monitoring wells, and sampling points on scaled site plans using captured GPS coordinates. Investigation points are plotted automatically to generate accurate plan views that reflect true spacing, elevation, and site context. Overlay engineering drawings or base plans, adjust scale, and add notes or color coding to highlight utilities, access constraints, environmental features, remediation areas, or investigation boundaries. As new boreholes or samples are logged, site plans update automatically to maintain accuracy from fieldwork through final reporting. Use plan views directly as report figures or for coordination between field crews, consultants, and project managers. Eliminate manual drafting of boring location plans while improving precision and consistency.
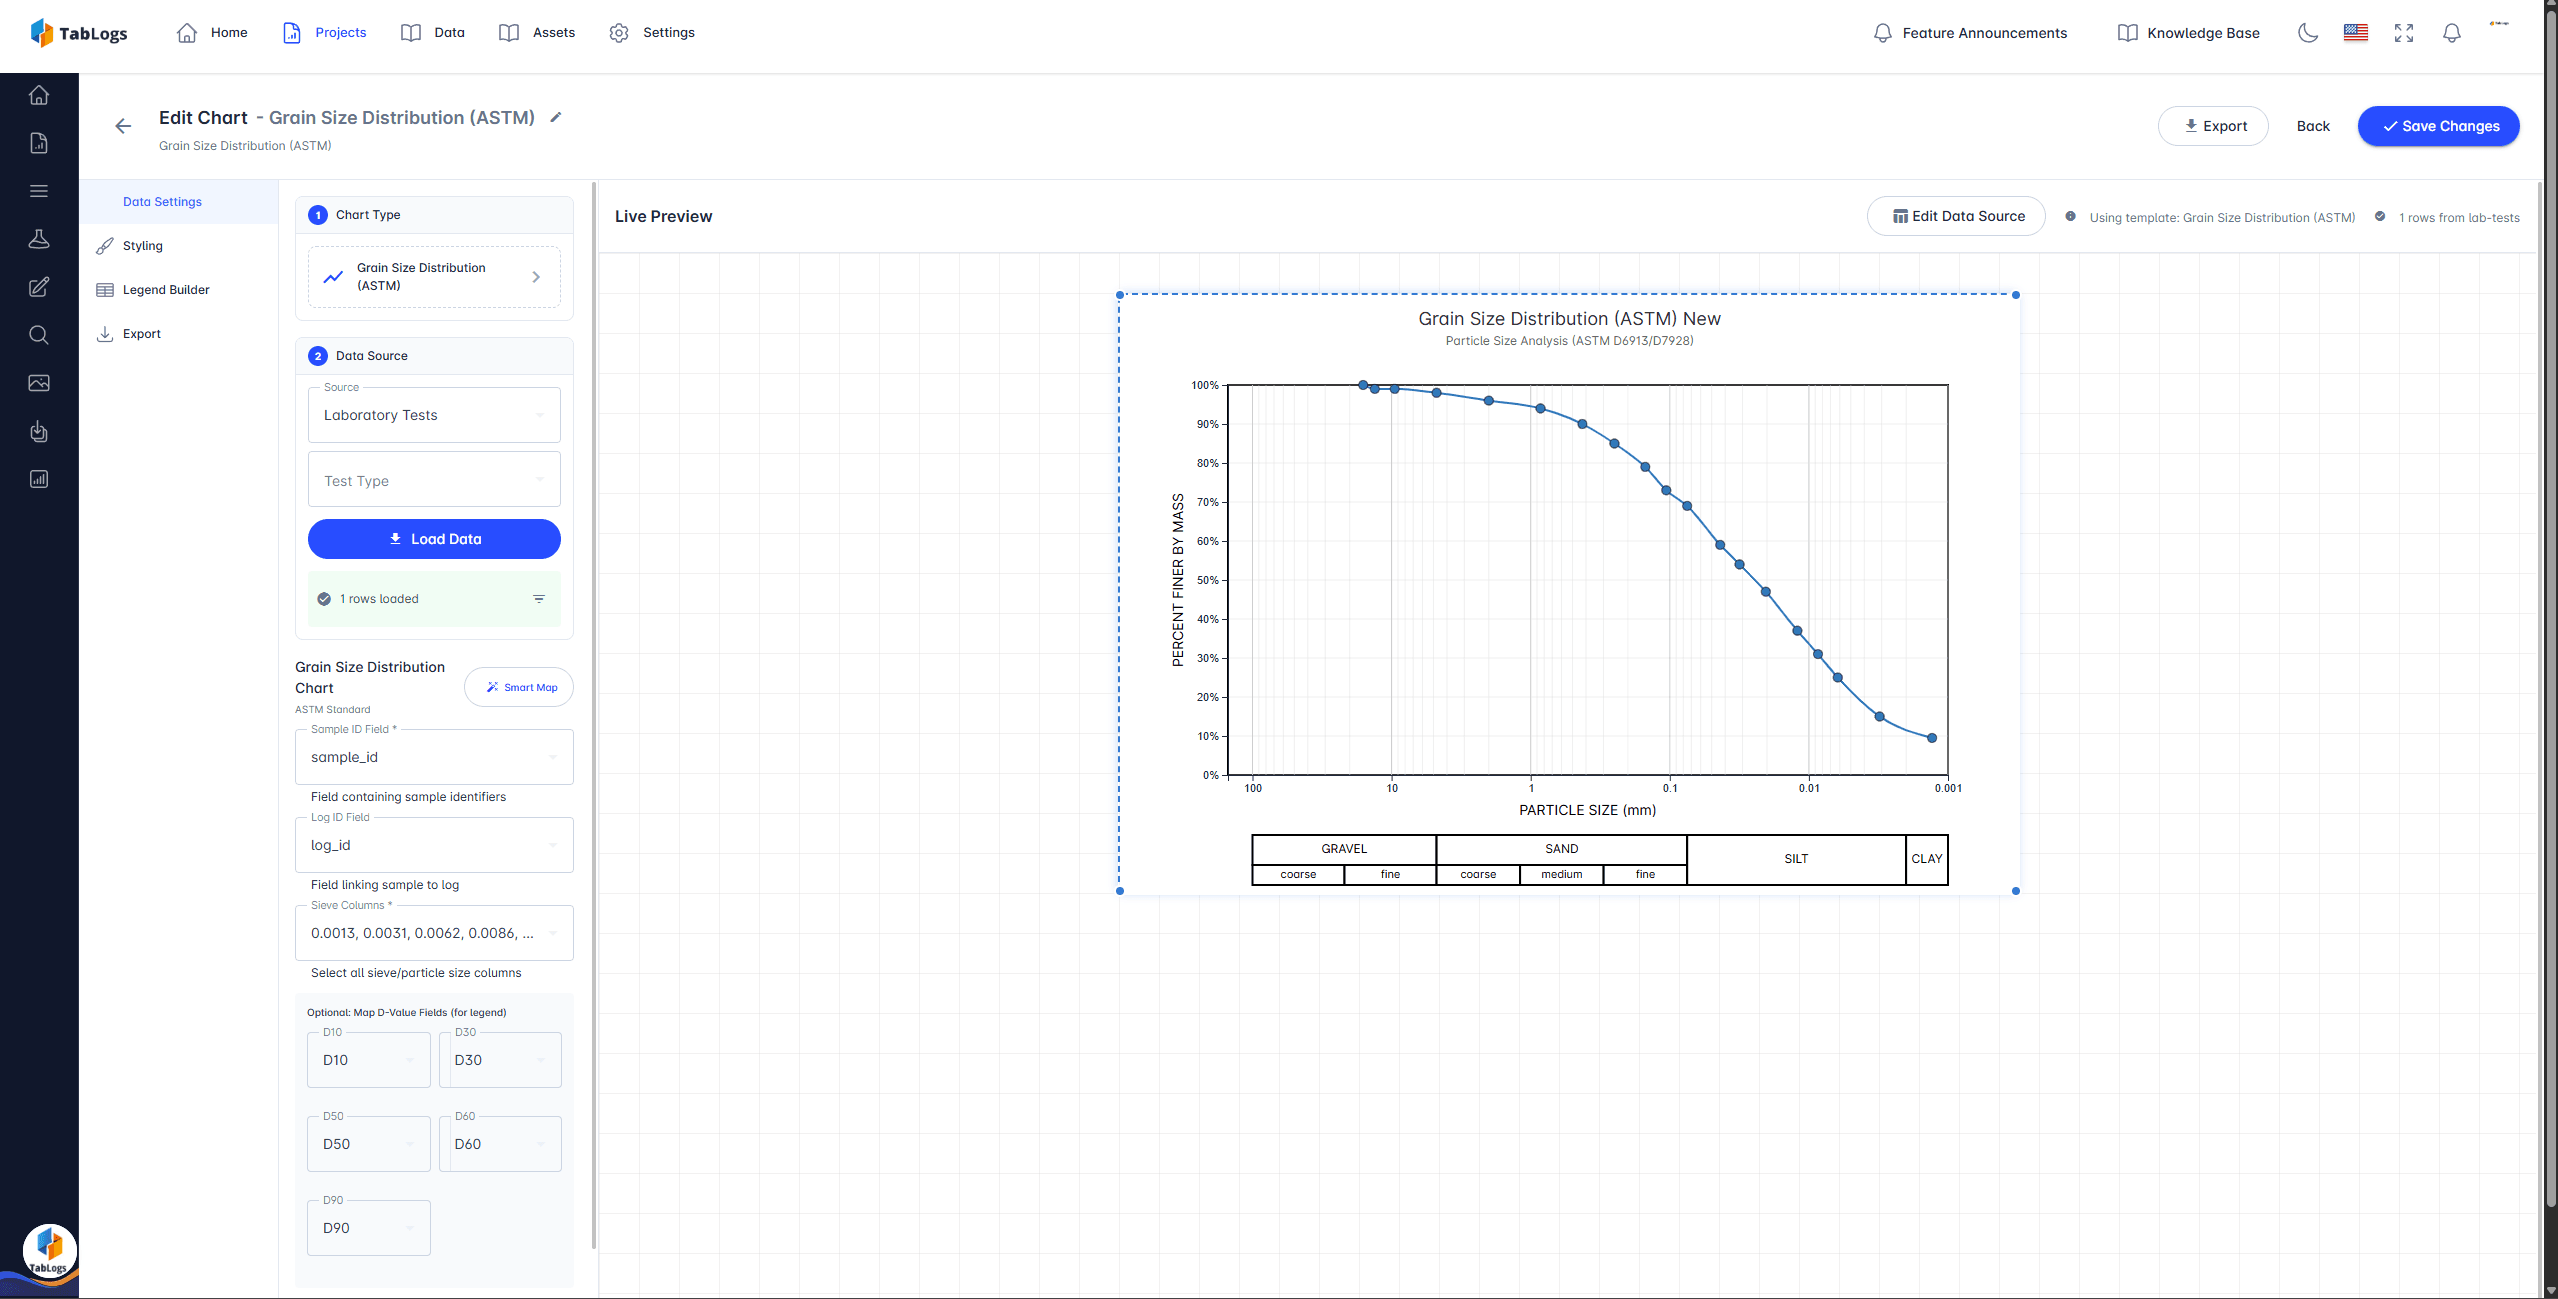
Built for Canadian Geotechnical and Environmental Reporting
Every visualization is generated directly from structured field data, reducing transcription errors and improving quality assurance across borehole logs, cross sections, fence diagrams, and site plans. Standardized symbology and data-driven figures support professional reporting requirements for projects across provinces and territories in Canada. Whether working on transportation infrastructure, municipal developments, mining projects, environmental remediation, or Phase II Environmental Site Assessments, your visuals remain aligned with your logged data. Improve report clarity, streamline internal review cycles, and deliver consistent, defensible subsurface interpretations that support engineering design and regulatory submissions.
Ready to visualise your data?
Create stunning cross-sections and site plans with TabLogs.