Borehole Log Visualisation for New Zealand Site Investigations
Turn your borehole and CPT data into clear cross sections, fence diagrams and mapped site plans that support defensible geotechnical interpretation across Aotearoa.
Data Visualisation
Interactive subsurface views
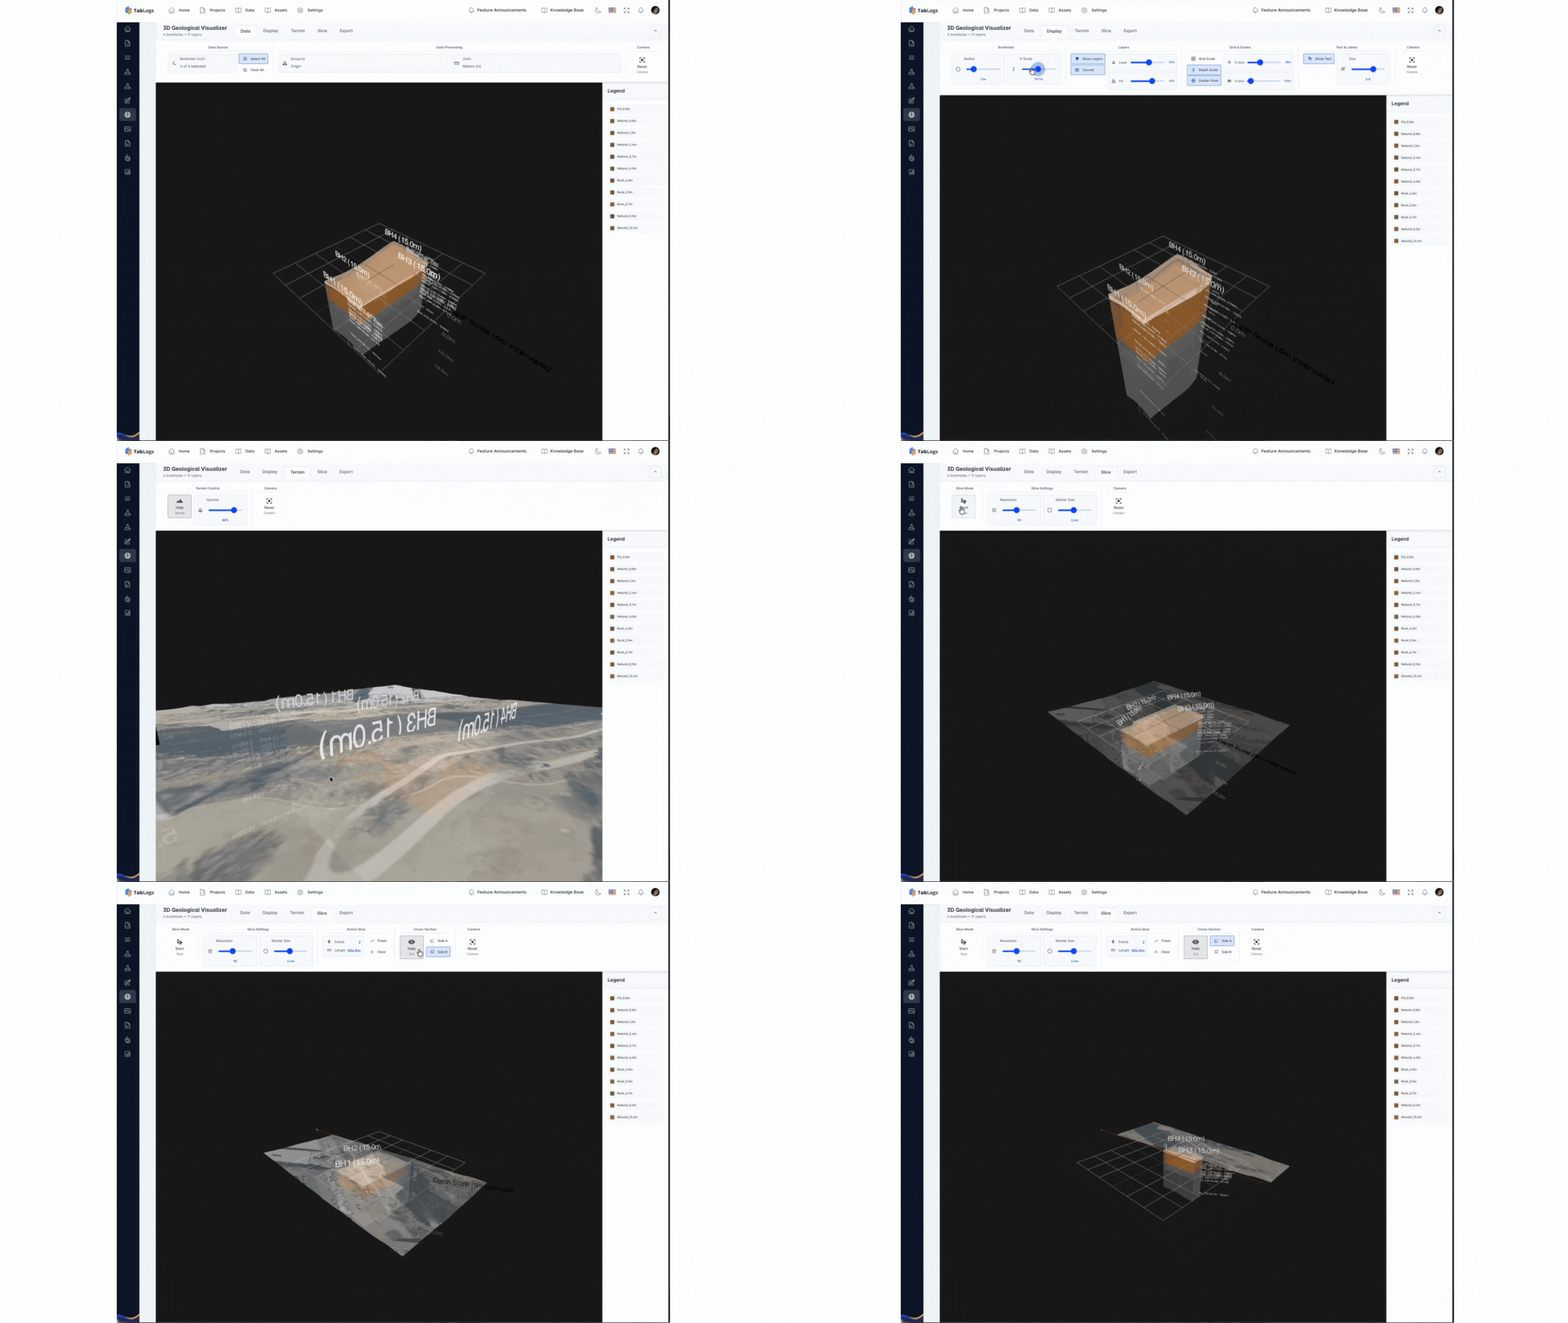
Generate Cross Sections from Borehole and CPT Data
Create geological and geotechnical cross sections directly from your borehole logs and CPT data. Automatically align boreholes along a selected chainage or custom section line and generate scaled sections that clearly display stratigraphy, material descriptions, sample depths and groundwater levels. Adjust vertical exaggeration, control layer display order and apply consistent symbology across projects. Quickly identify changes in soil and rock profiles, depth to refusal, weak layers and key founding strata. Export cross sections as high resolution figures ready for inclusion in geotechnical interpretive reports, foundation assessments and slope stability studies.
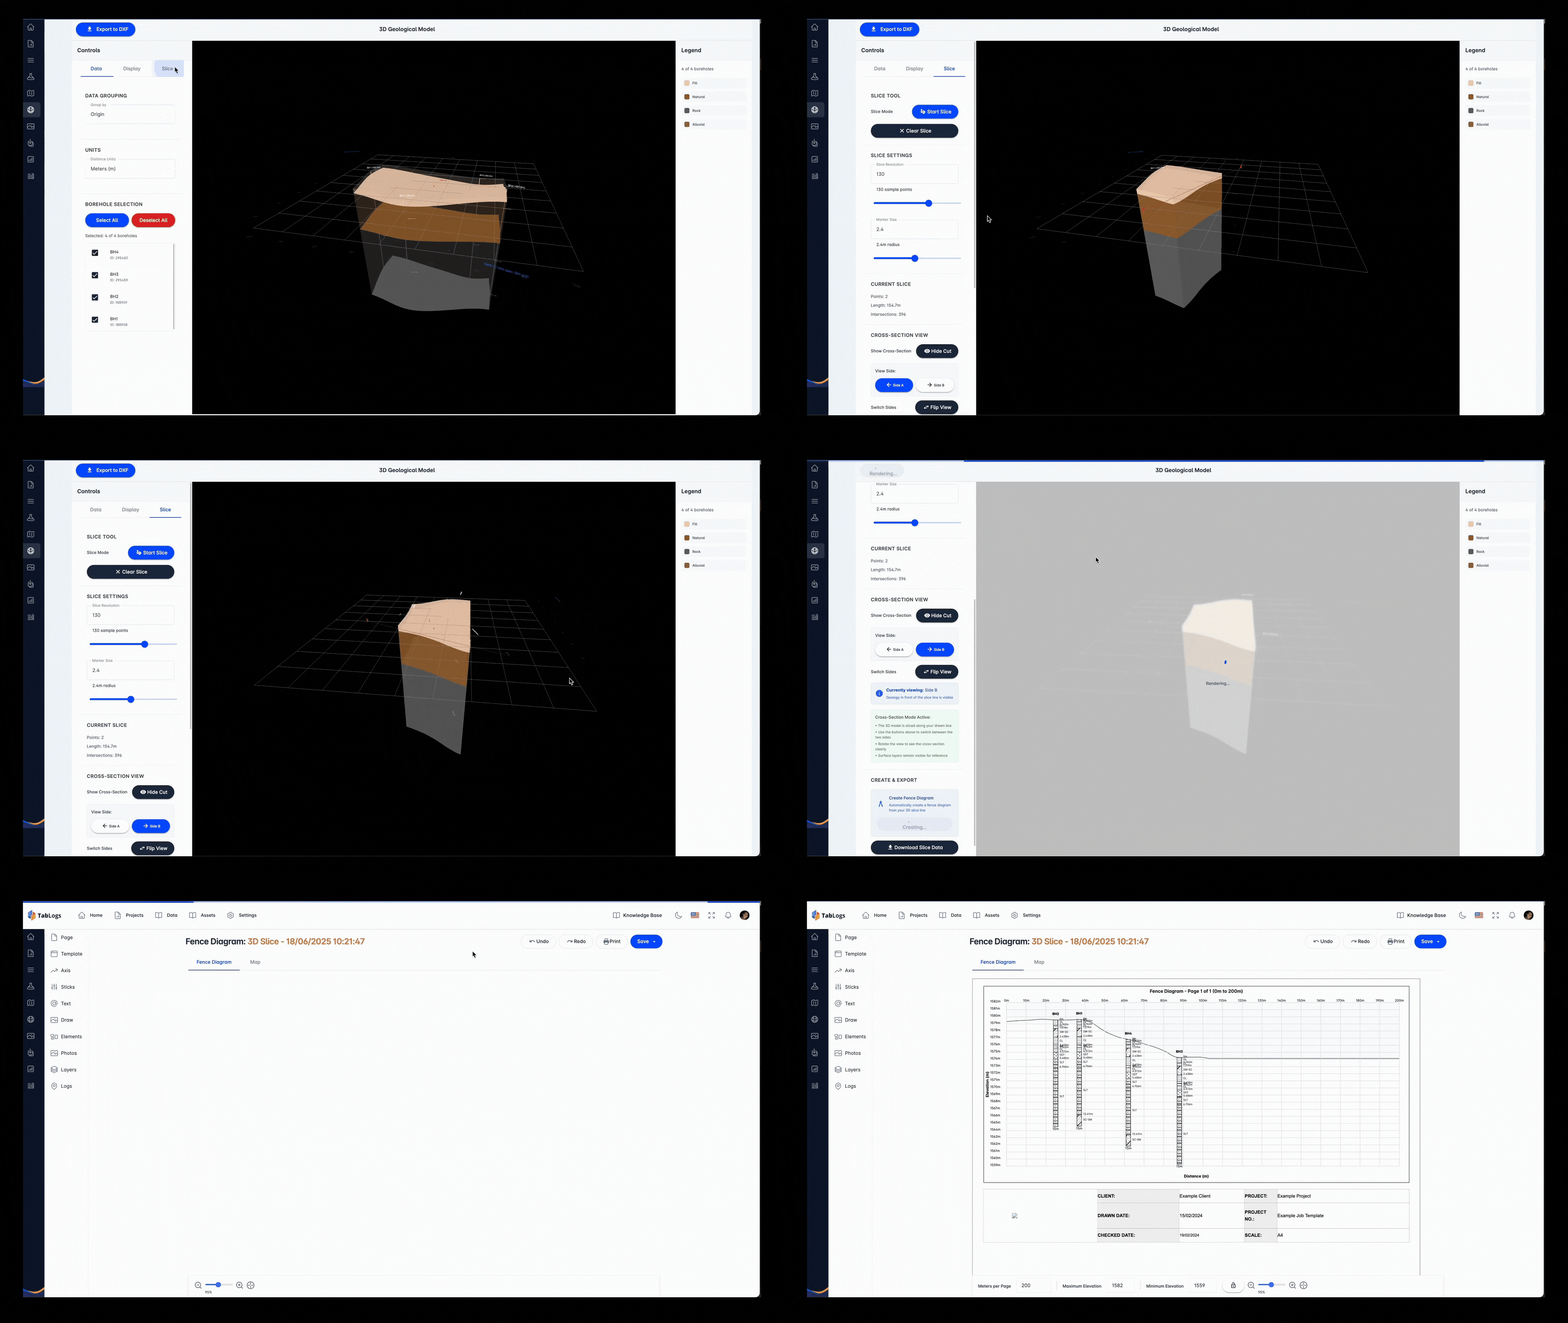
Create Fence Diagrams to Interpret Stratigraphy Across Your Site
Build fence diagrams across multiple boreholes to visualise lateral variability and stratigraphic continuity. Automatically interpolate layers between boreholes while maintaining control over how materials are grouped and displayed. Display soil and rock units by classification, origin or custom project rules to ensure consistent presentation. Clearly communicate fill extents, weathering profiles, alluvial sequences and volcanic or residual soil transitions common across New Zealand projects. Fence diagrams can be exported directly into reports and supporting documentation, helping consultants present defensible subsurface interpretations to clients, contractors and reviewing authorities.
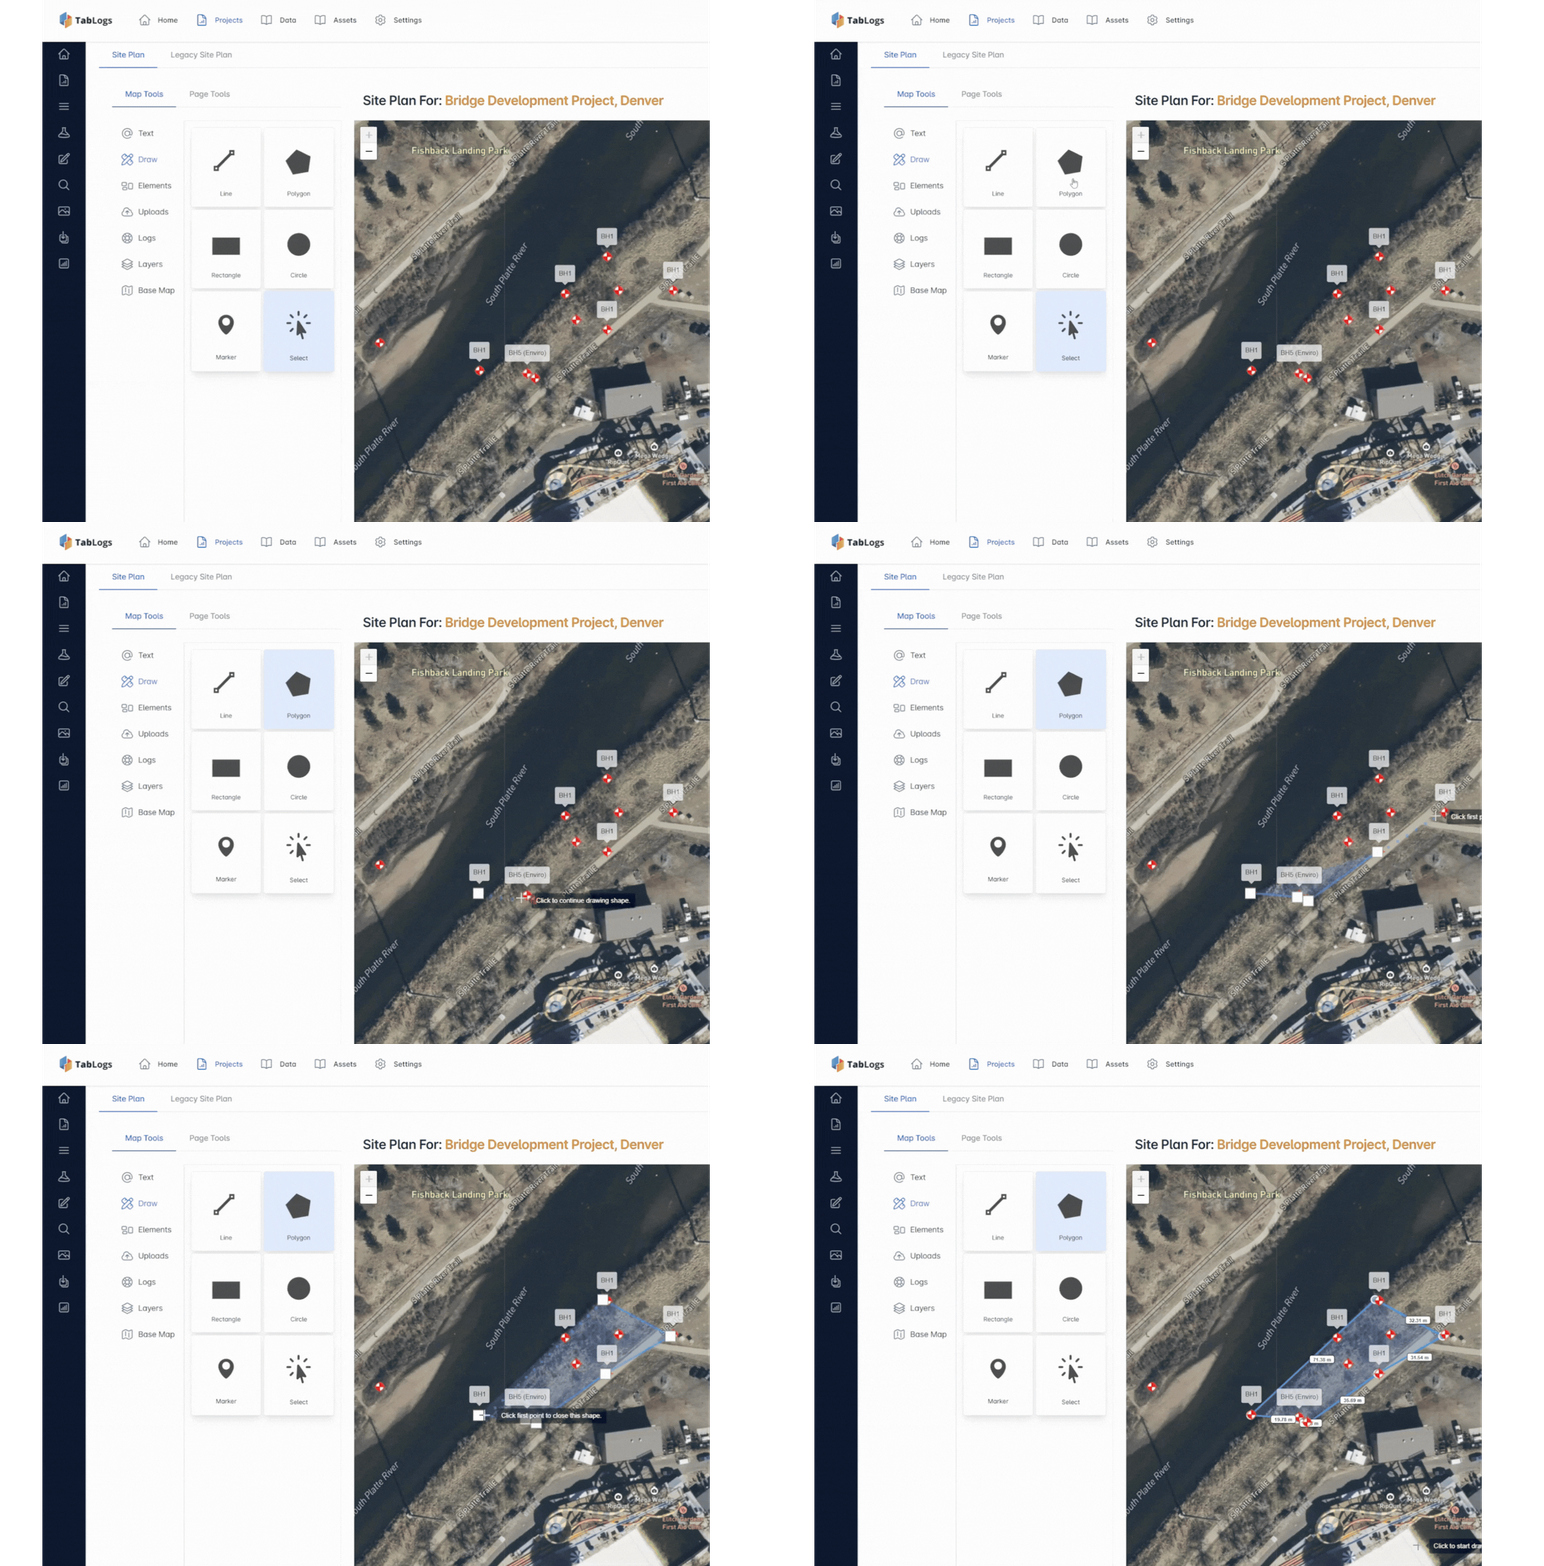
Map Boreholes and Test Pits on Scaled Site Plans
Automatically map boreholes, test pits and monitoring wells using captured GPS coordinates or imported survey data. Generate scaled site plans that show investigation coverage, spacing and proximity to existing infrastructure. Overlay site boundaries, proposed building footprints and key features to support foundation design, pavement investigations and environmental assessments. Add notes and labels to highlight constraints such as access limitations, services, or areas of uncontrolled fill. As new data is logged, site plans update to reflect the current investigation scope, reducing manual drafting and improving figure consistency from fieldwork through to final reporting.
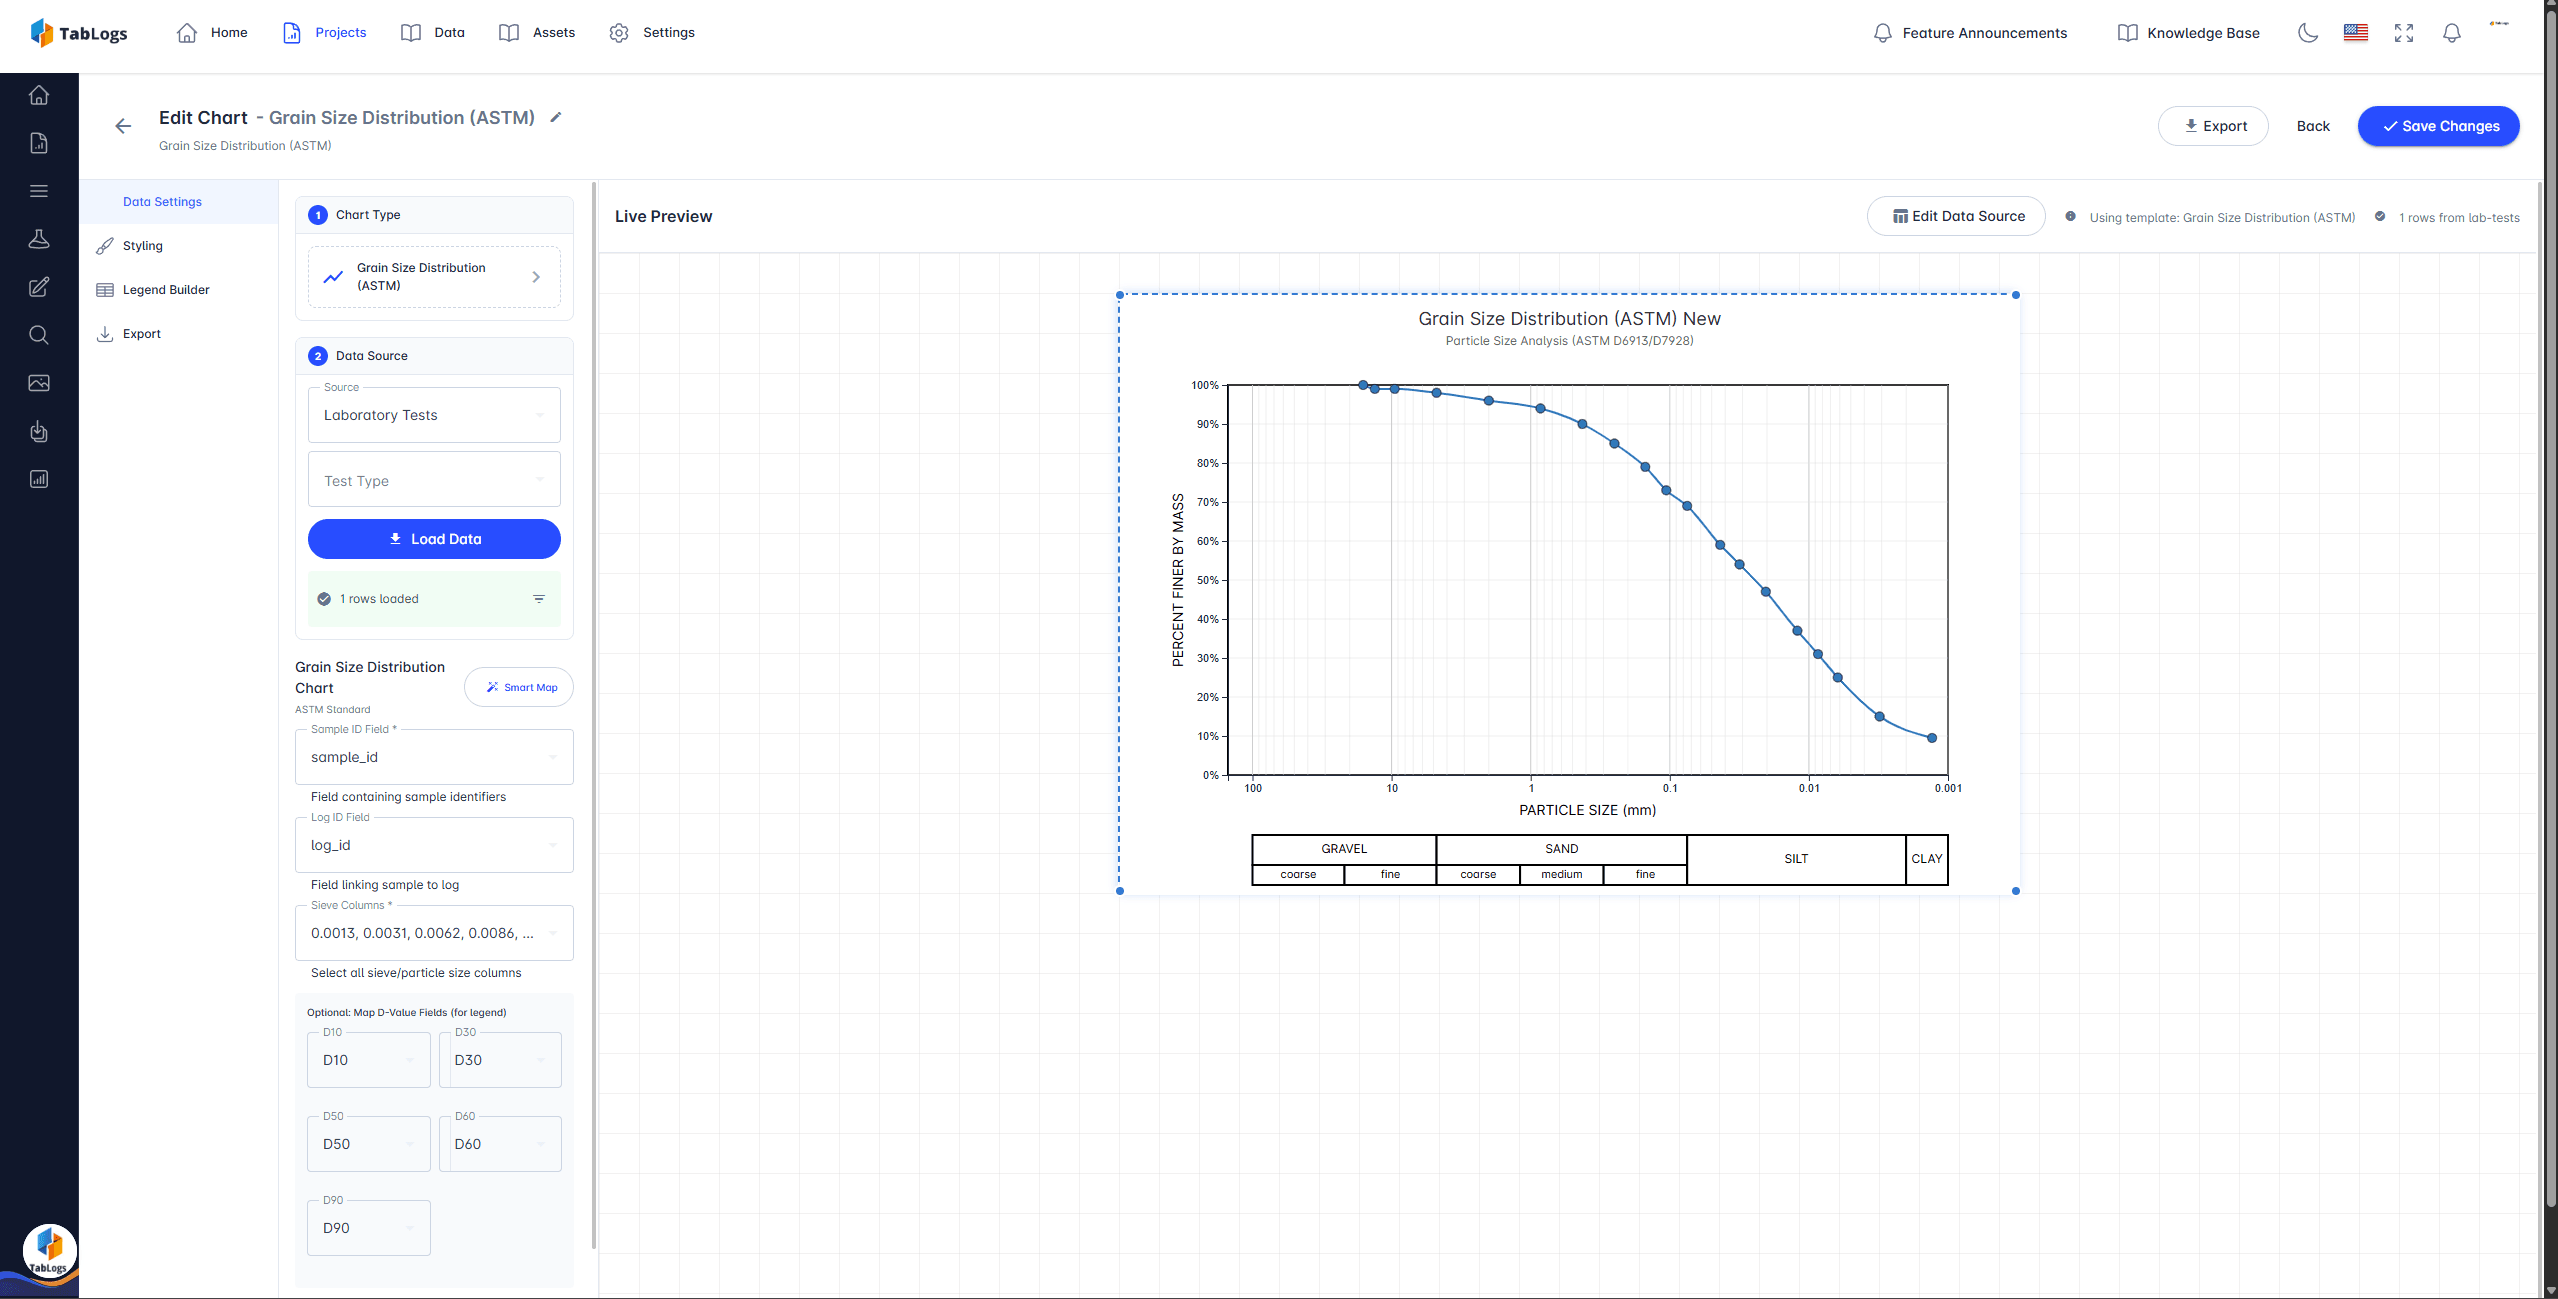
Aligned with New Zealand Reporting and Investigation Workflows
Visual outputs are generated directly from your logged field data, helping reduce transcription errors and maintain consistency between borehole logs, cross sections and report figures. Support investigations across residential subdivisions, commercial developments, transport corridors and infrastructure upgrades. Clear, standardised visuals assist with internal peer review, client communication and submissions to councils and regulatory authorities. Maintain consistent symbology and presentation standards across projects while adapting outputs to suit your internal QA requirements.
Ready to visualise your data?
Create stunning cross-sections and site plans with TabLogs.