Environmental Site Assessment Software for Phase I
and Phase II Investigations
TabLogs is geoenvironmental site assessment software built for consultants managing Phase I and Phase II ESA programs. It connects field sampling, chain of custody tracking, laboratory coordination, and compliance reporting in a single cloud-based platform. Environmental consultants use TabLogs to capture soil and groundwater data in the field, maintain defensible sample records through to the laboratory, and generate structured deliverables that stand up to EPA, state, and client review.

How Environmental Consultants Use TabLogs Across a Project
From initial site investigation through to defensible, compliance-ready reporting.
Field Sampling and Site Investigations
Environmental consultants use TabLogs in the field to record soil and groundwater samples, field observations, and contamination indicators as investigations progress. Structured data capture helps ensure sample details, locations, depths, and observations are recorded consistently at the point of collection, even when working across multiple sites or teams.
Sample Management and Laboratory Coordination
As samples move from the field to the laboratory, TabLogs maintains continuity between field data and laboratory analysis. Sample records, chain of custody information, and test results remain linked, reducing manual handoffs and helping consultants maintain clear, defensible records throughout the investigation.
Reporting and Regulatory Review
When it’s time to report, all investigation data is already structured and accessible. Consultants can generate clear, professional deliverables that support Phase I and Phase II assessments, reduce QA effort, and stand up to regulatory and client review without last-minute reconciliation.
Groundwater Monitoring Software for Long-Term Compliance Programs
Groundwater monitoring programs run for years, quarterly or semi-annual events across dozens of wells. TabLogs keeps each well's full history, water levels, purge volumes, field parameters, and lab results, tied to one well ID from the first round to the last. Field parameters like pH, temperature, specific conductance, dissolved oxygen, and ORP get logged at the well head, then checked against historical trends and regulatory action levels without pulling data from separate spreadsheets. As programs mature, reporting gets heavier. Because the data's structured from day one, trend graphs, exceedance summaries, and state EDDs don't mean reconstructing years of records. Consultants managing multiple sites can see which wells are due, which have exceeded limits, and where trends are heading from one dashboard.
- Well network management. Track construction details, screened intervals, and sampling history for every well across every site in one system.
- Field parameter capture. Log water levels, purge data, and field parameters at the well head, synced the moment you're back in signal.
- Trend analysis & exceedance flagging. Compare current results against historical data and regulatory limits automatically, so exceedances don't get missed in a spreadsheet.
- EDD & regulatory reporting. Generate electronic data deliverables and LTM reports formatted for state and EPA submission requirements.
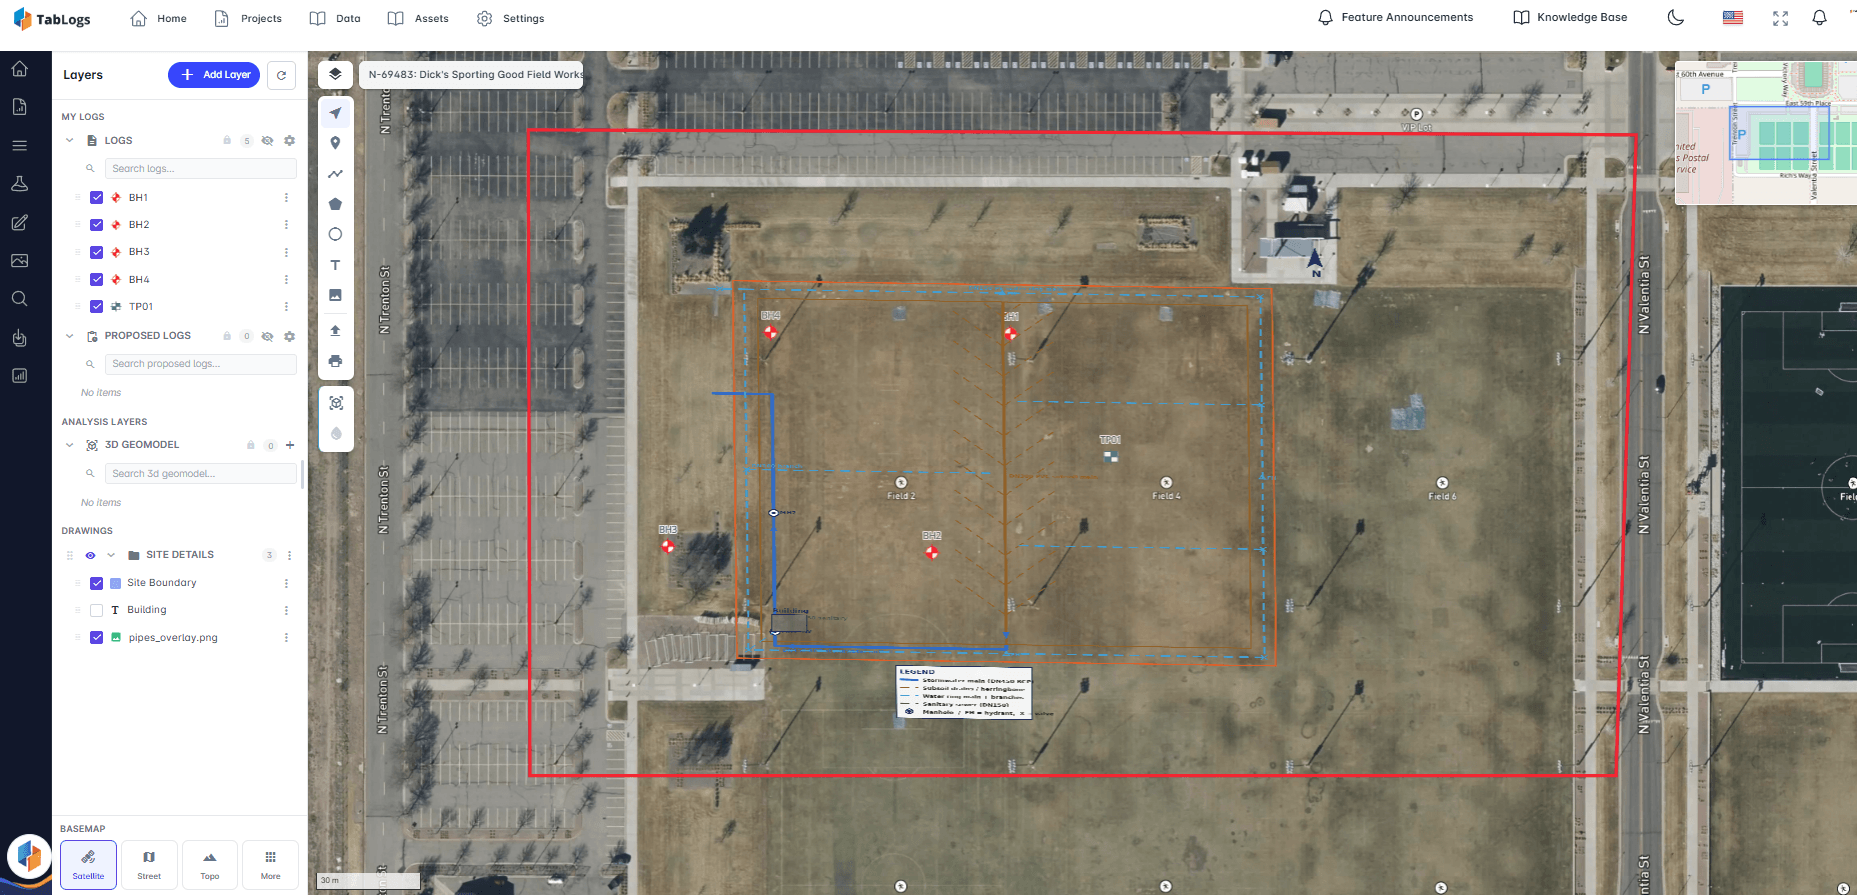
Plan Borehole Locations Around Existing Site Utilities
Before a rig goes on site, TabLogs lets consultants overlay proposed borehole and monitoring well locations against known site utilities, stormwater mains, sanitary sewers, water lines, and subsoil drains, directly on the site map. Utility layers can be added from as-builts or site drawings, so clashes with buried infrastructure show up before drilling starts, not after a hit.
- Utility overlay mapping. Import site drawings and utility layers alongside satellite or drone imagery.
- Clash detection at a glance. See proposed and existing log locations against utility lines to catch conflicts early.
- Site boundary & layer control. Toggle utility types, drawings, and log layers independently to keep the map readable on complex sites.
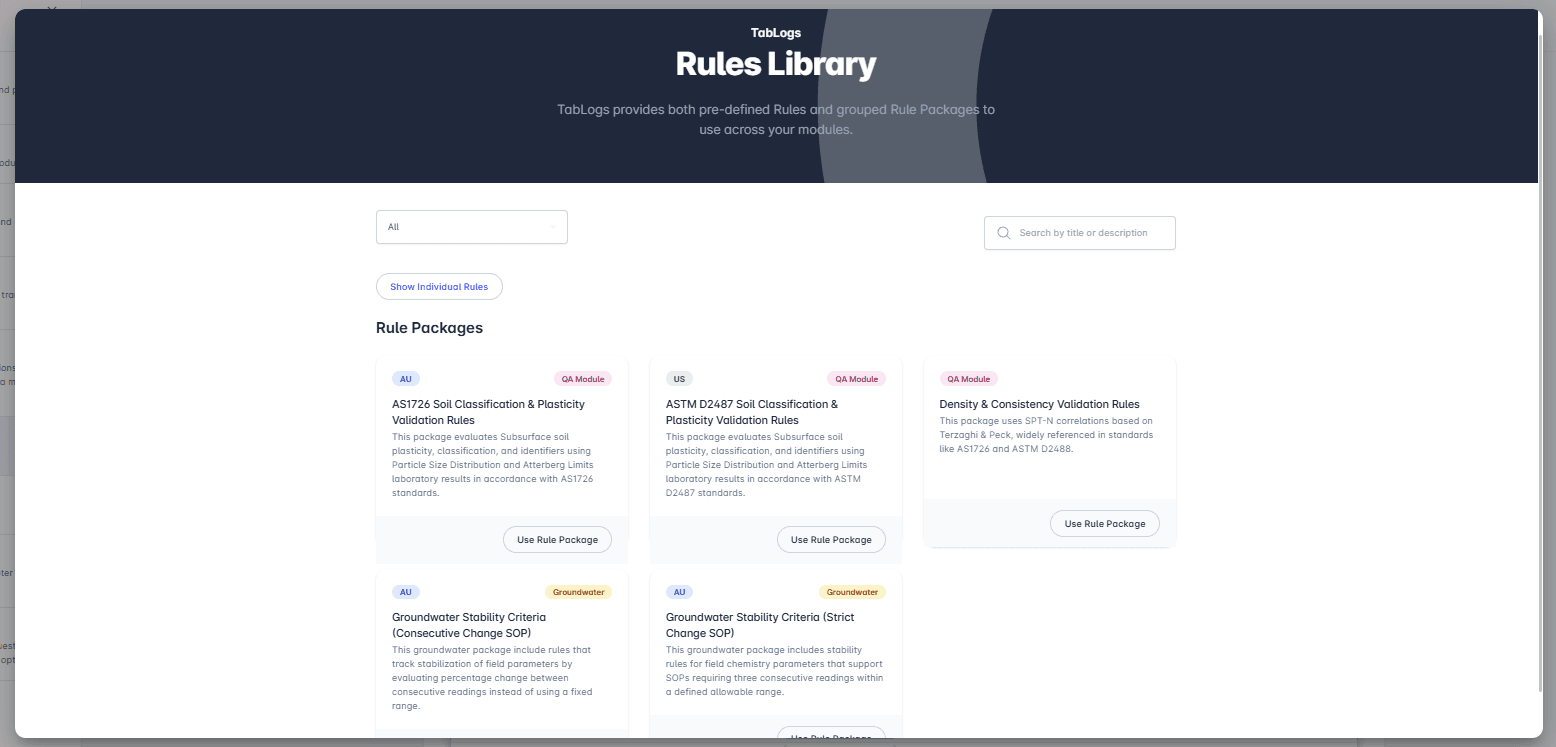
Automated Groundwater Stabilization Checks, Built to Your SOP
Sampling too early, before field parameters have truly stabilized, is one of the easiest ways to compromise a groundwater result. TabLogs applies stabilization logic to field readings as they're logged, so field staff know the moment criteria are met and reviewers have a defensible record that they were. TabLogs supports both common approaches to defining stability:
- Fixed-range SOPs. Three consecutive readings must fall within a set range, typically ±10% of a target or baseline value, before sampling proceeds.
- Consecutive-change SOPs. Three sequential readings must each differ from the last by no more than 10%, evaluating stability record-to-record rather than against a fixed target.
Ready to streamline your environmental investigations?
Join consultancies using TabLogs for contaminated land assessments.